Electrochemical Impedance Spectroscopy (EIS) is one of the in-situ characterization techniques in electrochemistry, with extensive applications in fields such as hydrogen energy, lithium batteries, and electroreduction. Among others, addressing EIS testing in the hydrogen energy sector, especially fuel cell/water electrolysis cell EIS testing, Kewell Technology Co., Ltd. will post a series of feature articles leveraging its accumulated expertise in test equipment. These articles will cover topics ranging from basic principles and RC circuit analysis to common issues in cell EIS testing and spectrum interpretation, as well as single cell test equipment with EIS capabilities. The series will explain comprehensively our understanding of EIS and related equipment advancements. In this article, we discuss the basic principles of EIS and RC circuit analysis.
I. Basic Principles
The EIS technique works as follows: it applies small sinusoidal voltage/current perturbation signals to an electrochemical system, measures its current/voltage response at different frequencies (typically 10μHz~1MHz), particularly the phase difference and amplitude ratio, and thereby calculates the frequency-dependent spectrum of complex impedance. Its core principle lies in utilizing small perturbations to meet the linear response condition, enabling the system’s behavior to be characterized by a frequency-domain transfer function.
EIS calculations rely on the collected current and voltage data. For example, in a lithium battery system undergoing 20A DC operation, an AC current perturbation with a frequency range of 10000Hz to 0.1Hz and an amplitude of 2A (RMS) is applied. In this process, the current and voltage signals collected are as follows:
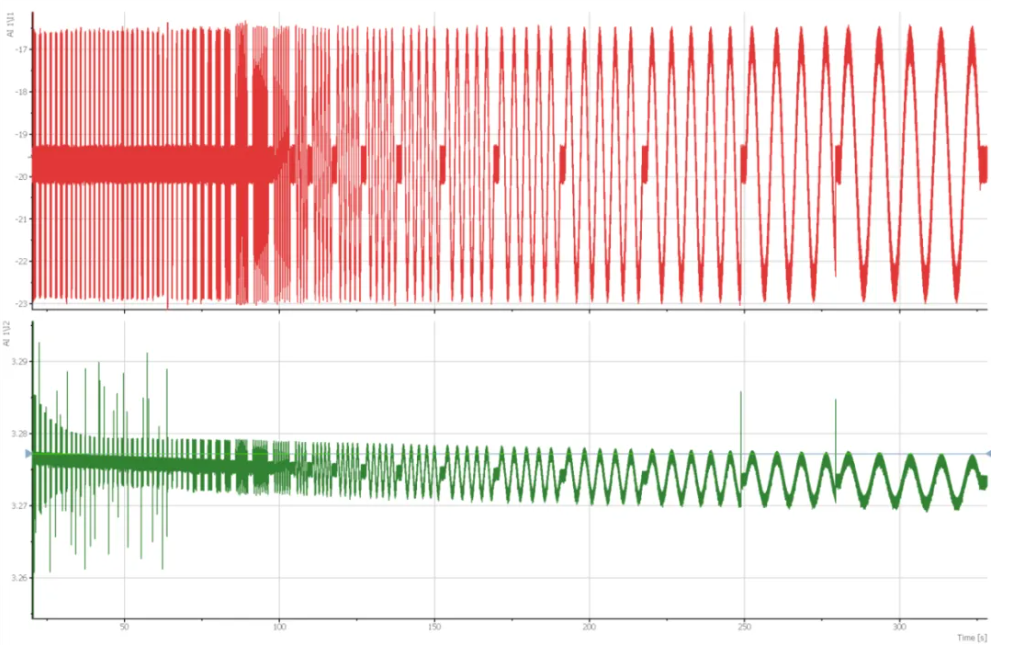
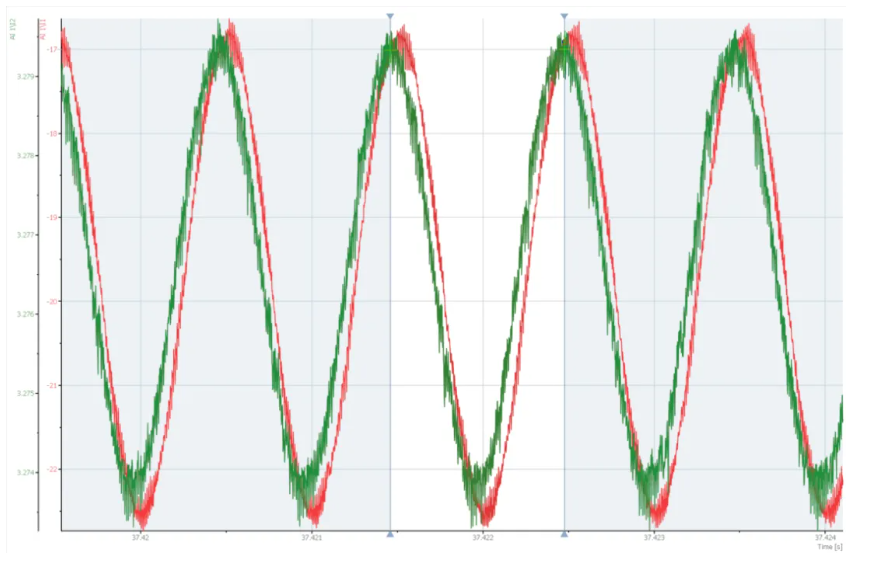
For each frequency, taking 1000Hz for example here, the raw current and voltage data are collected. Using FFT-related algorithms, the voltage-to-current amplitude ratio and the phase difference at each frequency can be easily calculated. This yields the complete impedance data for that frequency spectrum. Similar analysis of other frequency points provides information for every frequency point within the sweep range, ultimately generating the full spectrum of EIS data.
The basic principles of EIS are straightforward; what's complex is analyzing the EIS test results. Assuming the test results are free from interferences, EIS analysis can be broadly categorized into two dimensions. The first dimension involves associating the results with relevant circuits—typically multi-order RC circuit—to achieve high consistency between circuit simulation results and test results. Common methods include Equivalent Circuit Modeling (ECM) and Distribution of Relaxation Time (DRT) analysis. The second dimension focuses on correlating RC circuit parameters with internal processes of the device under test (DUT). By analyzing changes in RC parameters, the internal state changes of the DUT can be interpreted, thereby realizing online monitoring.
Whether it’s ECM or DRT, understanding RC circuit is the first step in EIS analysis. Thus, this article focuses on the impact of RC parameters on EIS spectra.
II. Analysis of RC Circuit
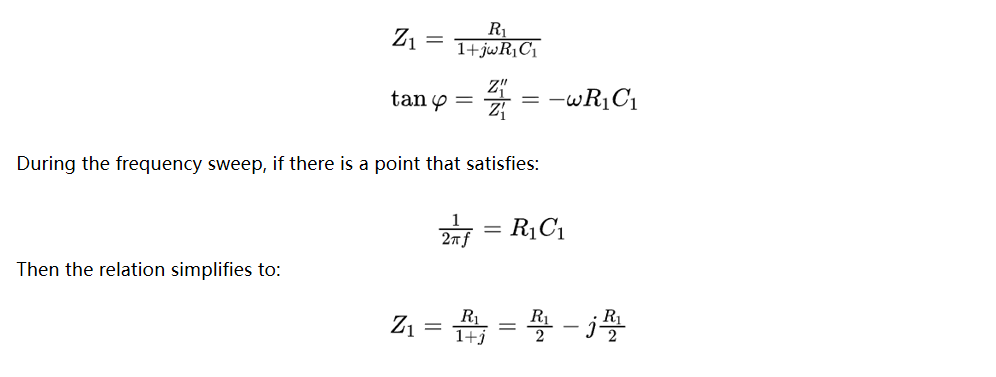
From a theoretical perspective, conventional test objects can generally be considered as combinations of resistors, capacitors, and inductors. In most studies, researchers are primarily concerned with the mass transfer and reaction processes within the test object at lower frequencies, where capacitive effects dominate, resulting in a predominantly negative phase position. Here we have a simple RC parallel circuit:
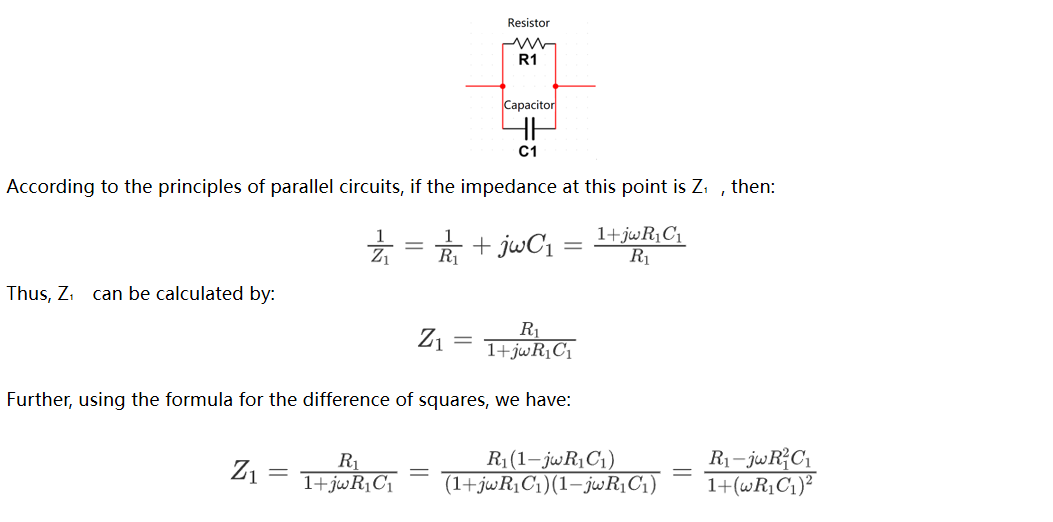

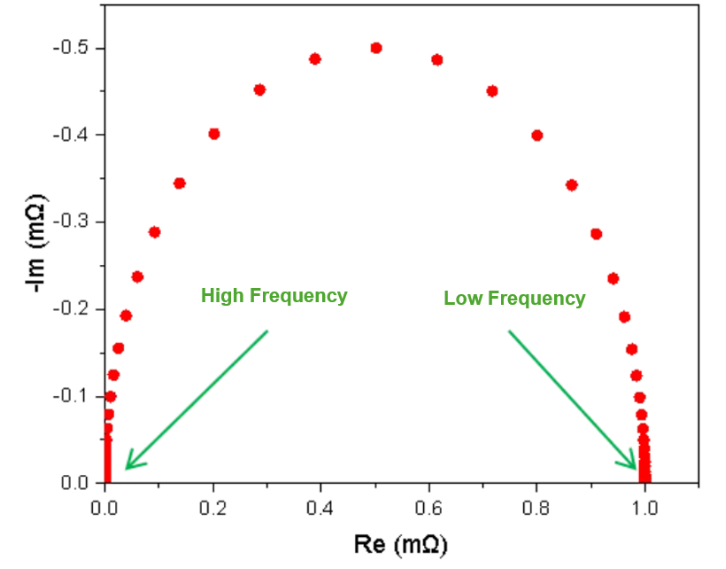
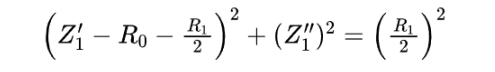
It indicates that the plot of the imaginary part versus the real part in a first-order RC parallel circuit is a semicircle with the resistance as its diameter. The frequency determines the magnitude of the phase angle, which in turn defines the position of the point on the Nyquist plot.
The Nyquist plot for a typical RC parallel circuit is shown below. In practice, at very low frequencies, the capacitive reactance of the capacitor is large, and the current primarily flows through the resistor. At this point, the external impedance of the RC parallel circuit is at its maximum, and the phase angle approaches 0°. As frequency increases, the capacitive shunting effect becomes more pronounced, and the phase angle approaches -90°. Due to the this shunting effect of the capacitor, the impedance of the RC parallel circuit decreases. An ideal RC circuit cannot intersect the real axis in the high-frequency region. The intersection with the real axis observed in actual EIS tests results from the inductance of the DUT and the test circuit wiring.
The RC product is generally referred to as time constant. In an RC parallel circuit, when the product of R and C is the same, the phase difference in the Bode plot remains identical. However, a larger R value results in a correspondingly higher impedance.
For a first-order RC circuit, consider the following question:
This impedance corresponds to the top of the arc, and the frequency at this position is related to the time constant.
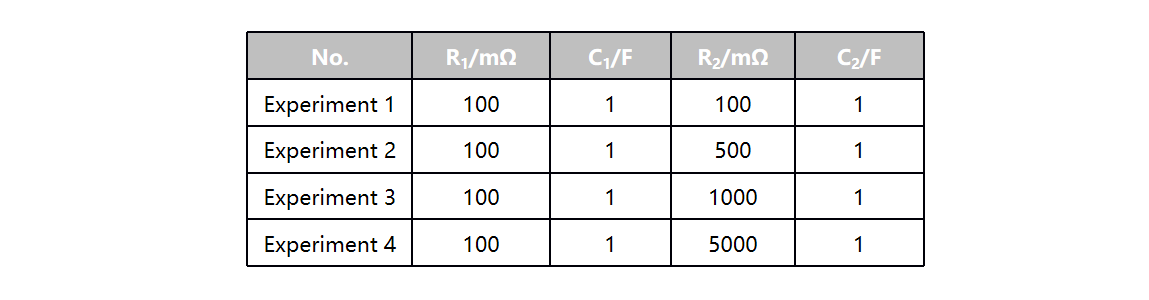
Furthermore, the impact of RC parameter variations on the impedance spectrum should be further investigated. The variations can be categorized into three cases: changes in R value, changes in C value, and changes in the RC product.
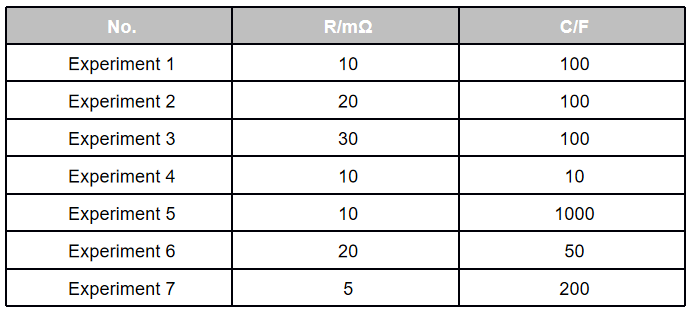
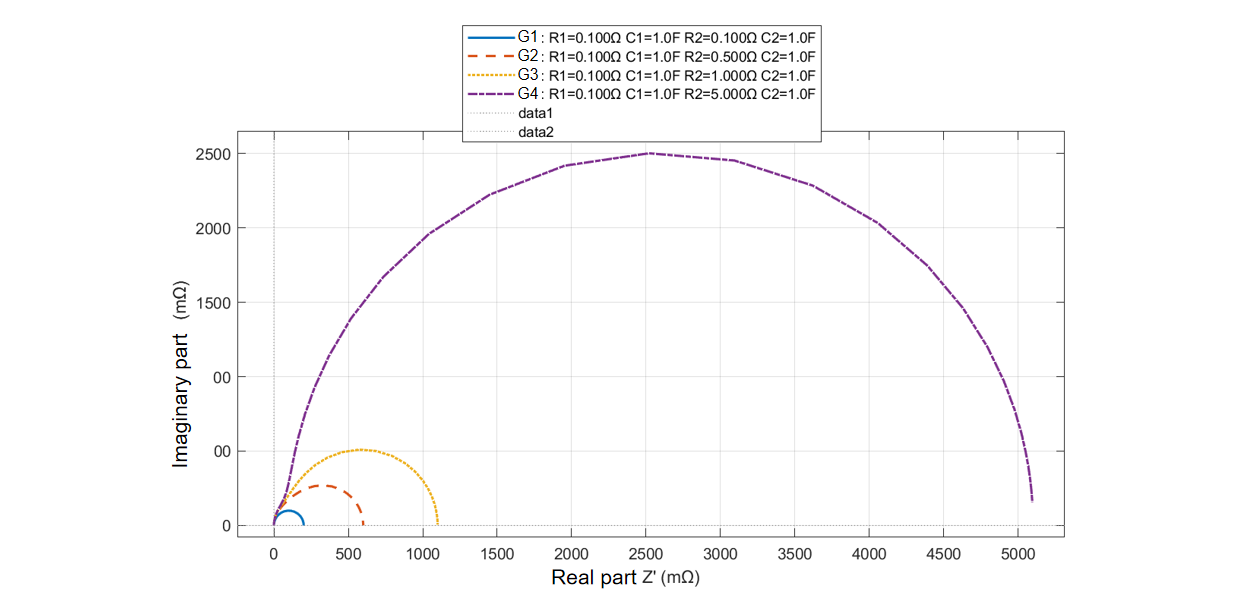
Experiments 1, 2, and 3 investigated the impact of resistance variations on the results, as shown in the figure below. The left graph indicates that when capacitance and frequency are constant, a higher resistance results in a larger impedance magnitude and phase difference closer to the capacitive region—these are evident from the fundamental expressions.
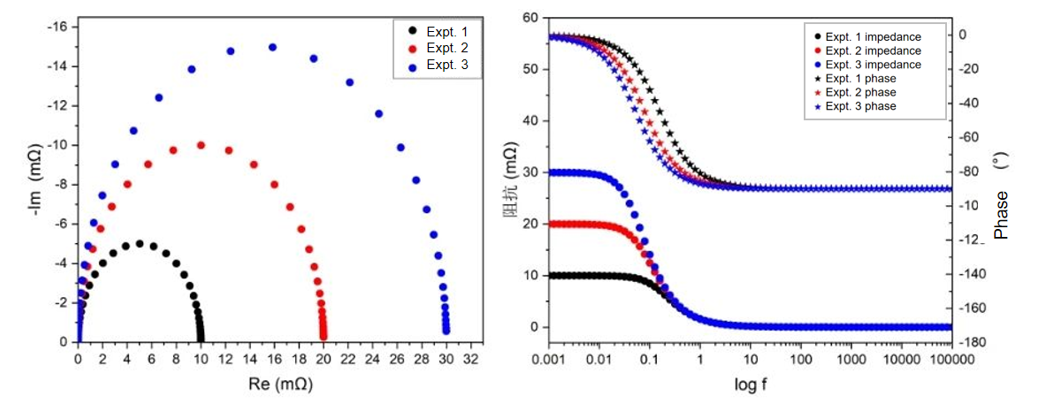
Experiments 1, 4, and 5 investigated the effect of capacitance on the results, as shown in the figure below. It can be observed that changes in capacitance do not alter the semicircular shape of the Nyquist plot. When both resistance and frequency are fixed, a larger capacitance leads to a smaller impedance value and a phase shift toward the negative region. For consistency, the magnitude here is defined based on positive and negative values. Therefore, a larger capacitance corresponds to a smaller phase difference.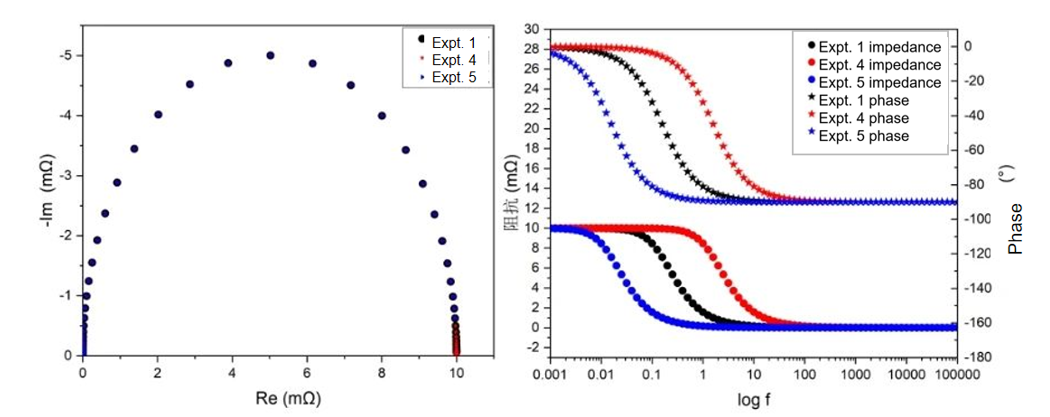
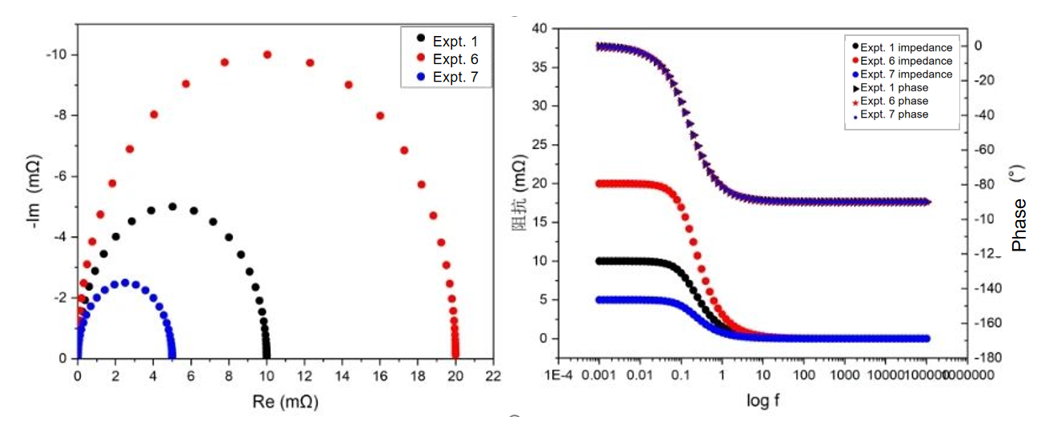
Experiments 1, 6, and 7 maintained a constant RC product. As shown in the figure below, the phase remains completely consistent, and the changes in impedance magnitude correlate with the variations in resistance.
First-order RC circuits are relatively simple, and their behavior can be broadly inferred from theoretical derivations. However, in practice, two typical phenomena occur:
1. The DUT has a certain amount of ohmic internal resistance.
2. The equivalent circuit of the DUT is composed of multiple RC stages.
For Case 1 above, the equivalent circuit is as shown in below:

The derivation process for its impedance is as described above, with the following results:
When resistance parameters of 5mΩ and 8mΩ and a capacitance parameter of 20F are selected, with a frequency sweep range of 0.1Hz to 10kHz, the resulting Nyquist plot is as shown below. The figure also includes data without R0. This phenomenon is commonly encountered in practical applications. For example, EIS testing during water electrolysis operation, due to the inherent internal resistance of the electrode tabs and variations in electrode clamp positioning during assembly, R0 values can be different, thereby influencing the results.
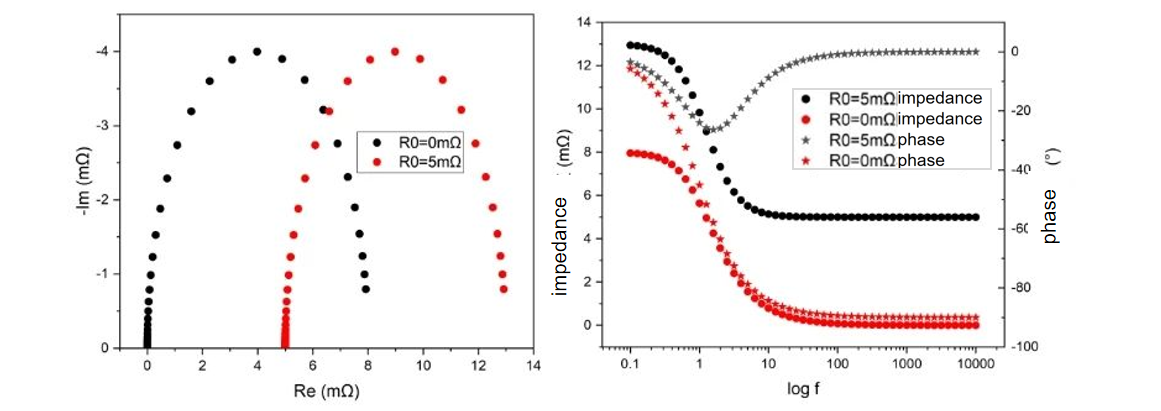
As shown in the figure above, different R0 values cause the entire curve to shift leftward or rightward in the Nyquist plot. And they have a significant impact on the magnitude and phase difference in the Bode plot, and there is no linear relationship.
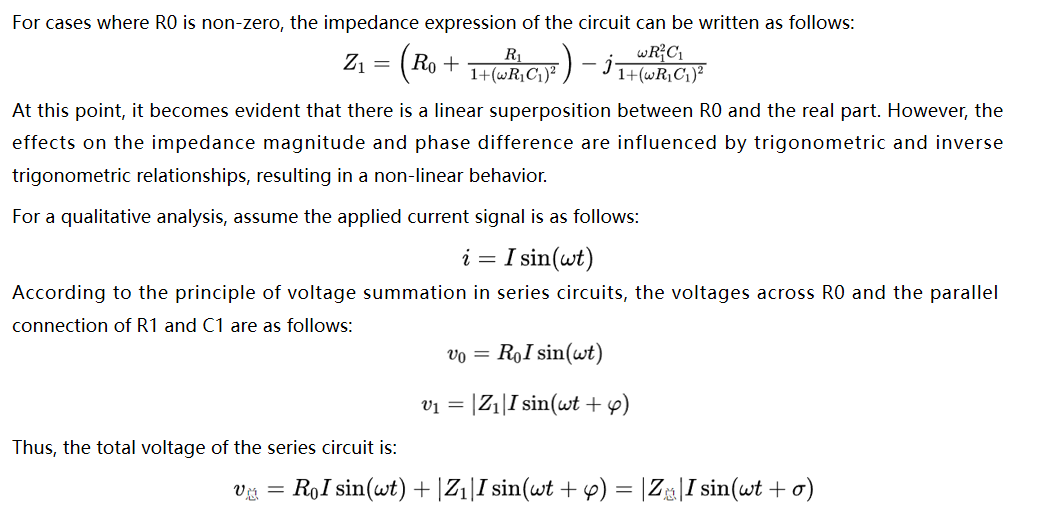
Vector addition determines that both magnitude and phase difference are non-linear in terms of addition and subtraction. In contrast, the real part corresponds to the projection of the overall impedance onto the horizontal axis, and this component undergoes linear operations.
If the wiring of the electrode clamps has introduced interference to the impedance results, corrections can also be made according to the above derivation to mitigate the impact of electrode clamp wiring on the test results.
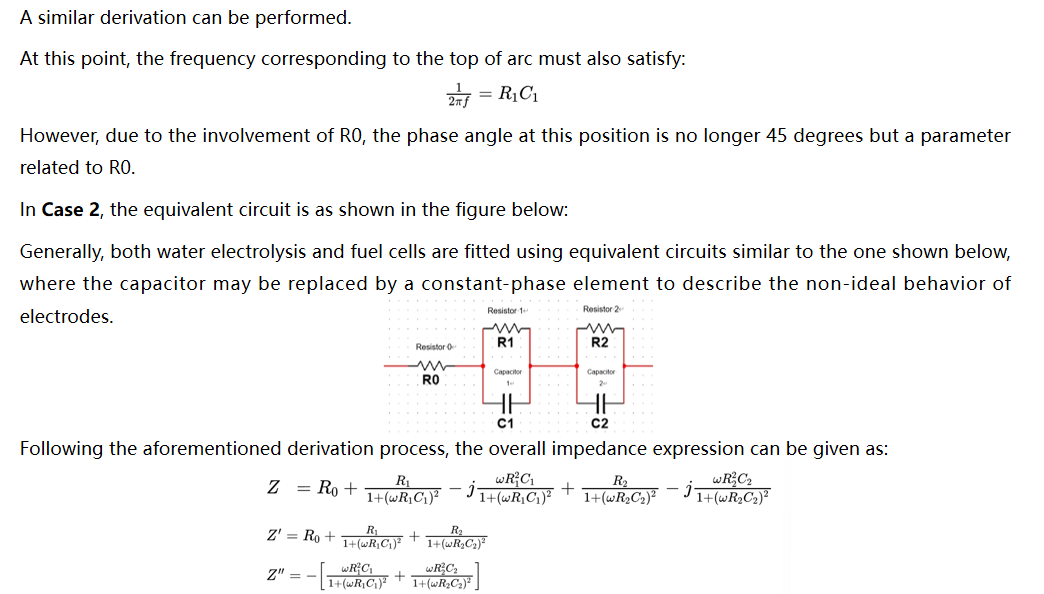
The relevant expressions are frequently described in literature related DRT. However, in practice, beyond second order, it becomes difficult to simplify the expressions of RC circuits into a standard circular form. This is because, at the same frequency, each RC stage produces its own response, and the final result is the vector superposition of the two RC stages and R0. Given the numerous parameters involved and the fact that first- and second-order elements does not affect the final result (in series circuits), analysis assumes R1C1 ≤ R2C2. Here, the time constant τ = R*C represents the characteristic time constant of each RC unit. The time constant also determines the frequency position of the relaxation process:

Second-order RC analysis is relatively complex. Current research focuses more on qualitative aspects. How to perform quantitative analysis and correlate it with the internal reaction processes of the DUT is key to advancing EIS toward broader applications. Quantitative analysis also involves two perspectives:
The first perspective is the traditional interpretation of RC parameters and their correlation with internal processes of the DUT, with ECM being a typical example. However, the main challenges with this method lie in the resolution of RC parameters and the subjective human factors involved in the fitting process. When using ECM, general time constants must differ by a factor of 10 or more to clearly distinguish two semicircles in an EIS spectrum. Yet, internal processes of the DUT often occur at smaller time intervals.
Taking water electrolysis as an example, internal processes may include electron transfer, proton transfer, anode reaction, cathode reaction, water vapor transport, and charge transfer at the diffusion layer-catalyst interface. Many of these processes have similar time constants—for instance, the reactions at the anode and cathode may not differ by a factor of ten. The final outcome is that these reaction processes with similar time constants blend into distorted semicircles. During ECM analysis, they are treated as a single RC component, except for processes with significantly different time constants—such as mass transfer and reaction processes.
During dynamic changes in the DUT, such as variations in current density, temperature, or even long-term decay, the RC value extracted through ECM analysis represents a composite value. While each parameter may evolve according to specific patterns, the resulting RC value remains difficult to resolve. This limitation is inherent to the fundamental principles of ECM itself.
The other perspective is DRT. The shortcomings of ECM are precisely the strengths of DRT. However, DRT itself is also addressing mathematically ill-posed problems, and the introduction of regularization may bring some subjective factors. Nevertheless, compared to ECM, DRT holds greater promise for resolving EIS analysis challenges. Further time is needed for algorithm optimization and for correlating the results with the processes of the DUT.
Regardless of the method, RC circuits serve as the foundation. Therefore, this article focuses on analyzing the impact of second-order RC parameters on the results.
Second-order RC circuits can be broadly categorized into three scenarios:
1. The resistors are comparable in magnitude, and the difference in time constant is caused by capacitance.
2. The capacitors are comparable in magnitude, and the difference in time constant is caused by resistance.
3. Significant differences in both resistance and capacitance, resulting in differences in time constant.
For Scenario 1, the following experiment was designed:
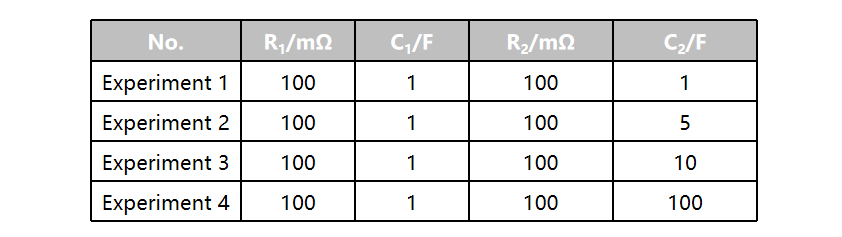
For Scenario 2, the following experiment was designed:
For Scenario 3, the following experiment was designed:

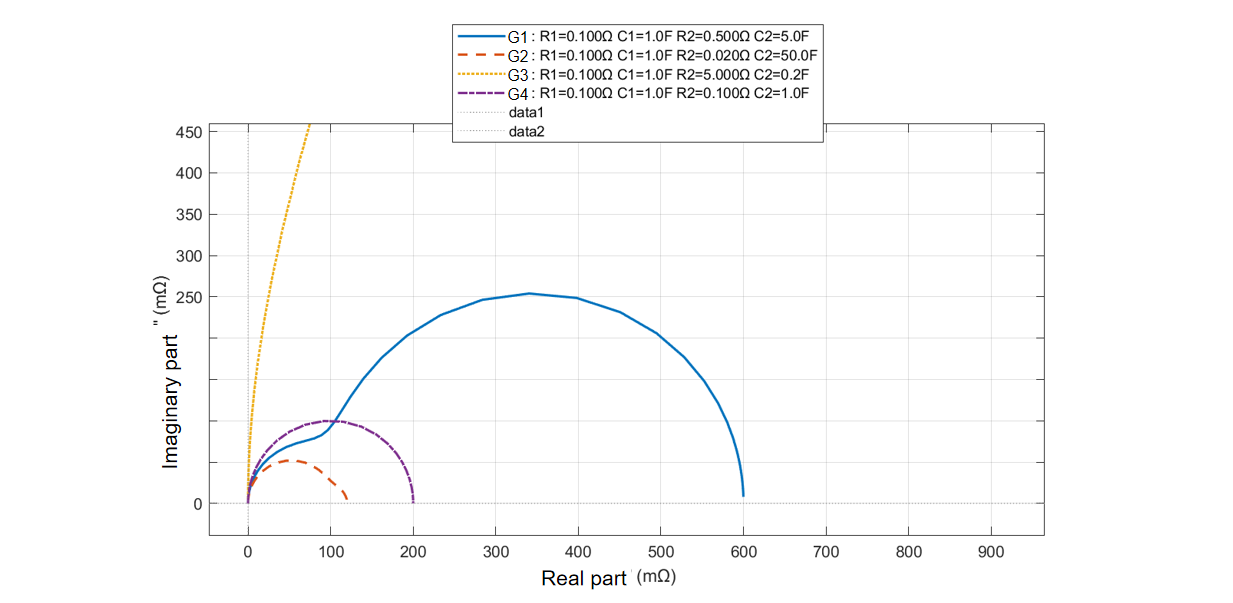
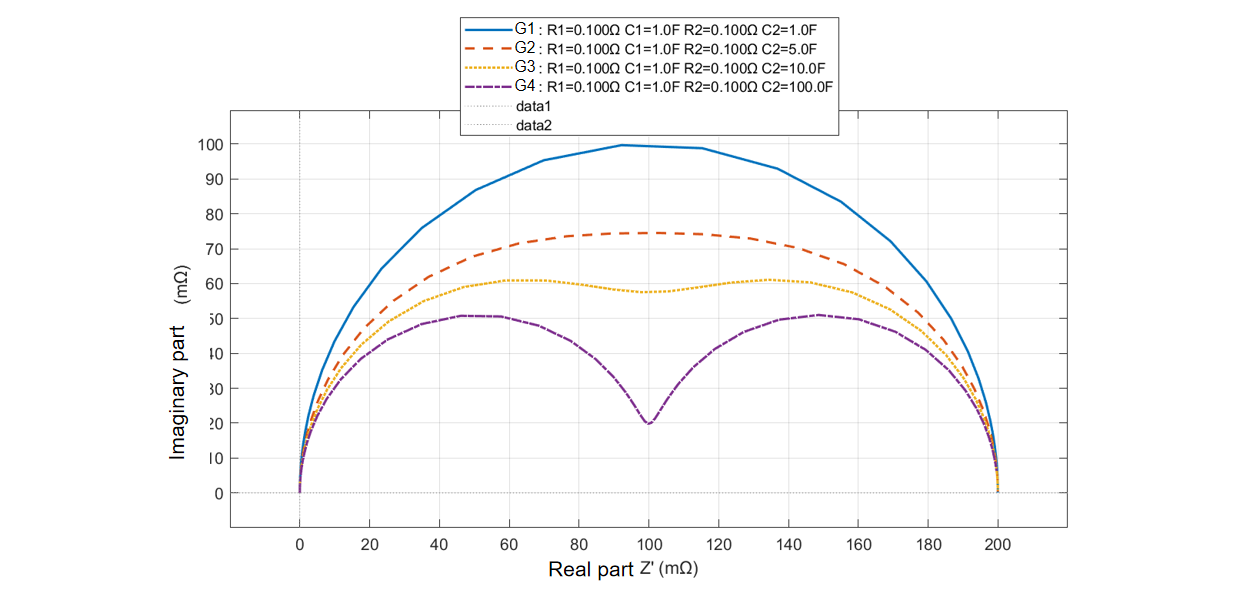
It can be seen from the figure that a ‘tenfold’ difference in time constants is merely a proposed value, as the actual outcome depends on the specific parameters of the RC circuit. When the resistances differ only slightly, even if the capacitances are relatively close, it is still quite easy to distinguish the double-arc structure. However, when the resistances differ significantly, the double-arc structure becomes less distinct.
If, like in a first-order circuit, the top of the arc is taken as a characteristic point, the situation becomes more complex for second-order circuits, as such a structure may not necessarily be exhibited clearly.
III. Single Cell Test Equipment with High-current EIS Testing Capability--C100 & E500 Series
EIS analysis requires theoretical accumulation, yet the industry currently faces the challenge of developing low-cost testing solutions for high-current EIS, particularly regarding the impact of water electrolysis power systems on EIS testing with electrochemical workstations. In response, Kewell Technology Co., Ltd. has independently developed power supplies for water electrolysis and loads for fuel cells with EIS testing capabilities. These are integrated into the company’s products: E500 (for electrolyzer cell) and C100 (for fuel cell). Capable of delivering up to 200A DC output while performing ±20A EIS testing, they eliminate the impact of power supply systems on electrochemical workstation EIS testing at its source.

With four-electrode wiring, the test results of the relevant products can be compared with those from electrochemical workstations domestically and internationally, as shown in the figure below:
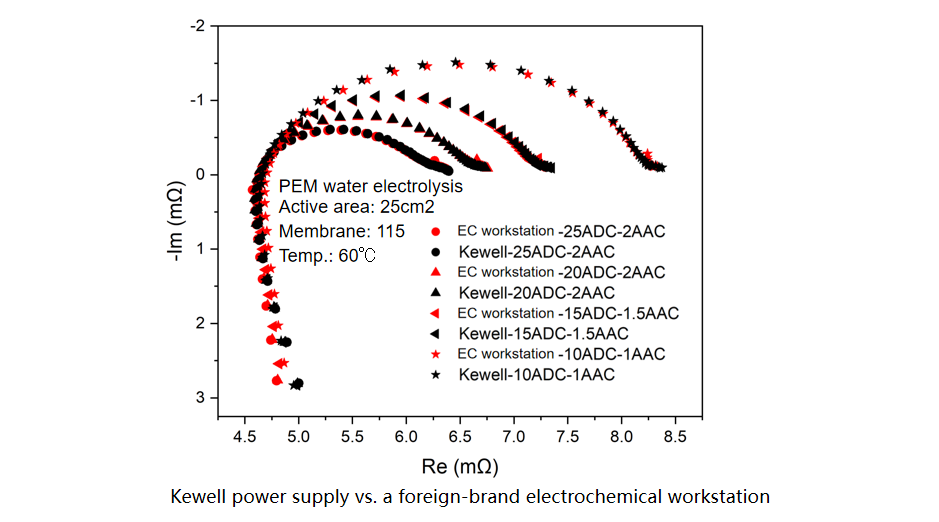
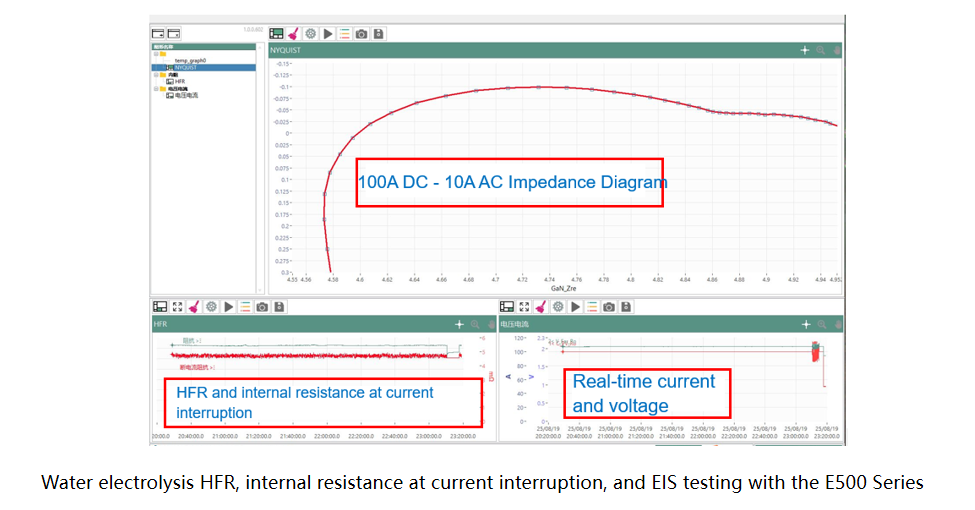
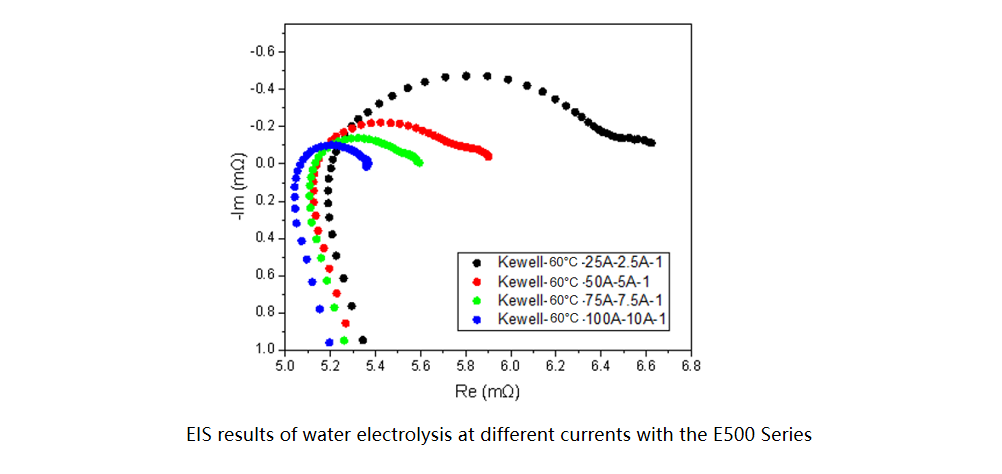
Additionally, the integrated C100 and E500 feature real-time HFR monitoring, real-time monitoring of internal resistance during current interruption, and dynamic operating conditions such as triangular wave, square wave, and linear sweep for current and voltage. Taking a PEM electrolyzer with an active area of 25 cm² as an example, its internal resistance monitoring during current interruption, HFR monitoring, and EIS test results during operation at 100A are demonstrated, along with EIS test results at 25A, 50A, 75A, and 100A. A comparison is also provided between the next-generation C100-P fuel cell test system and its predecessor C100-N, as well as a feature comparison of our standard products with domestic and international manufacturers.
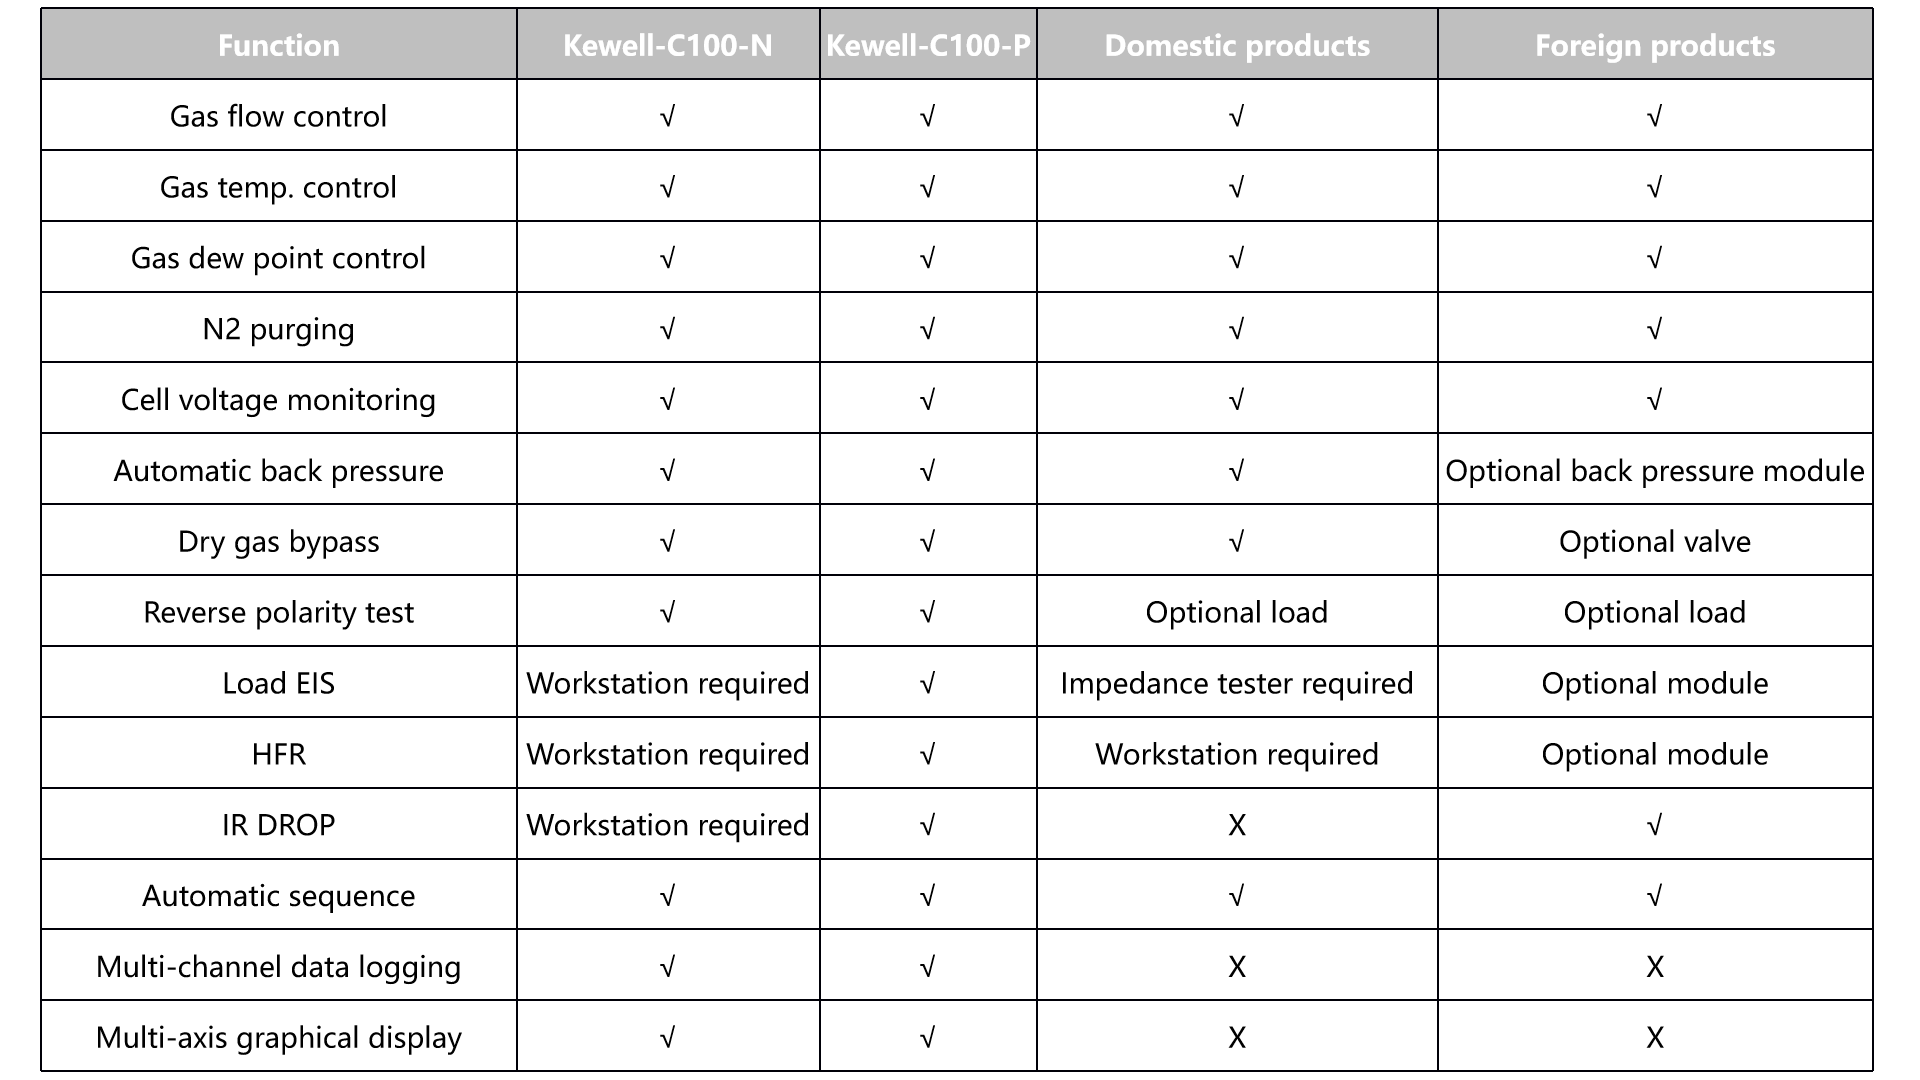
The next-generation C100-P fuel cell test system delivers performance metrics consistent with international counterparts, while its electrochemical indicators align with workstation test results. Leveraging its expertise in hydrogen-electric integration, Kewell has achieved seamless integration of multi-physical-parameter measurement and control with electrochemical testing in its single cell test equipment. This enhances the efficiency of hydrogen energy material research and development, enabling more precise and convenient testing.


 Position: