Proton Exchange Membrane Water Electrolysis (PEMWE) technology has emerged as a research hotspot in recent years, owing to its wide power range, high hydrogen evolution current density, and excellent adaptability to new energy power generation [1, 2]. However, the large-scale application of PEMWE remains hindered by issues pertaining to cost, service life, and performance. Conducting in-depth fundamental research is the primary approach to address these issues. The single-cell testing of PEMWE serves as the cornerstone of relevant fundamental research. Through performance evaluations, cyclic voltammetry (CV) tests, impedance tests, and durability tests, advancements can be achieved in electrolyzer materials, structures, and processes, thereby propelling the development of PEMWE technology. Among others, CV testing is capable of inferring specific information within the catalytic layer of the membrane electrode, including the Electrochemical Active Surface Area (ECSA), and it is one of the most frequently employed method of in-situ characterization. During the conventional CV testing process, the side under test uses humidified inert gas, typically nitrogen, whereas the opposing side is supplied with humidified hydrogen. The humidification of both gases serves two pivotal purposes: firstly, to maintain a good hydration state for better conductivity of the proton exchange membrane; secondly, to facilitate the redox reaction of noble metal catalyst that involves water. However, contrary to fuel cell test equipment, water electrolysis test equipment generally lacks the function of humidification, causing serious trouble to the conventional CV testing. Given the vital role of water in the CV testing process, it is imperative and essential for water electrolysis test equipment to investigate the impact of water on CV testing under non-humidified conditions.
The Hydrogen Energy Division of Kewell Technology Co., Ltd. has long been committed to the development of fuel cell and water electrolysis test equipment. Based on its self-developed E500 Series Electrolyzer Cell Test System, the self-developed 25cm2 fixture, and externally procured electrochemical workstation, in-depth research has been conducted on relevant testing conditions. The relevant tests and results are as follows [3].
1 Experiment
1.1 Experimental Device and Analytical Instruments
The purpose is to explore the in-situ measurement of CV in PEMWE. This experiment was based on the E500 Series Electrolyzer Cell Test System from Kewell Technology Co., Ltd., as shown in Figure 1(a). The electrolyzer cell fixture utilized was Kewell’s self-developed 25 cm2 cell fixture, as shown in Figure 1(b). Electrochemical experiments, including CV testing, were controlled using the DHE electrochemical workstation.
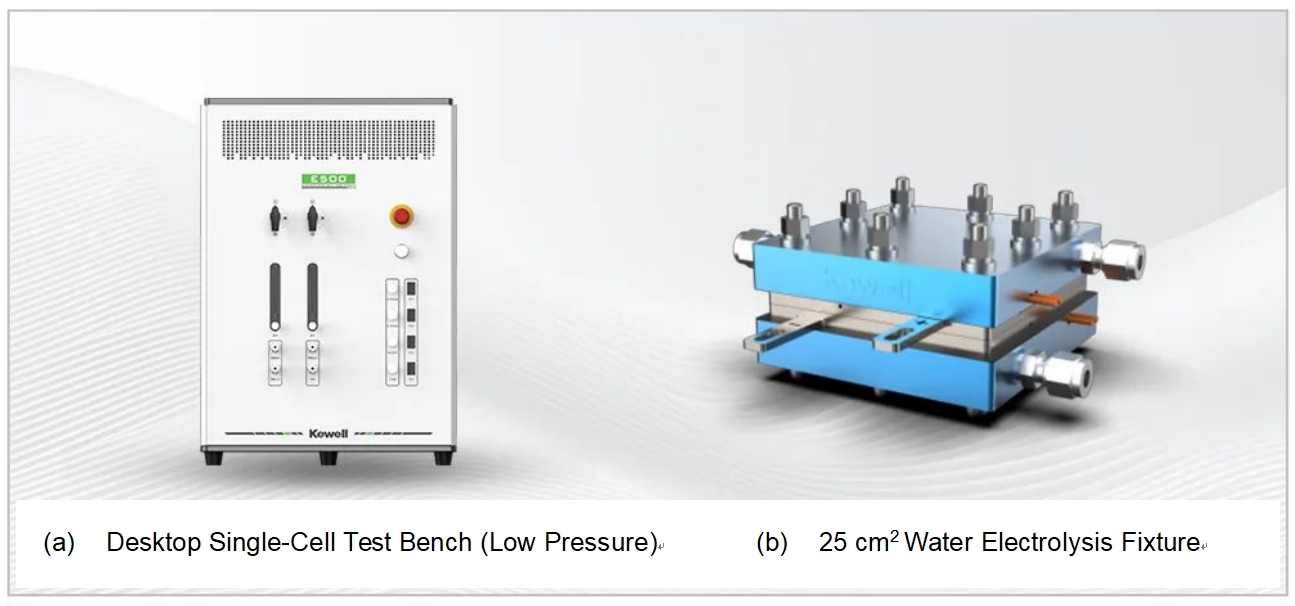
Fig. 1 Test Bench
1.2 Experimental Methods
According to the CV testing standards for PEMWE set by the EU [4], the water electrolysis cell was assembled to directly perform in-situ electrochemical testing under the following conditions: the cathode was supplied with dry/wet H2, the anode was supplied with H2O/N2, gas flow rate was 10 mL/min/cm2, and the temperature of the electrolyzer was 30°C; the reference electrode (RE) and counter electrode (CE) of the electrochemical workstation were connected to the cathode, the working electrode (WE) and the sensitive electrode (SE) were connected to the anode; CV scan rate was 20 mV/s, and test range was 0.4~1.4 V or 0.05~1.4 V. To systematically verify the impact of (i) the humidification conditions of the gas supplied to the water electrolysis cell and (ii) the state of the membrane electrode on the electrochemical CV testing, several schemes were adopted in this experiment: (1) the membrane electrode completely dry, compare the results of CV tests with dry/wet gas supplied; (2) compare the results of CV tests under different gas supply conditions of the anode and cathode; (3) compare the results of CV tests at different water content of the membrane electrode; (4) CV tests under other operating conditions.
2 Results and Discussion
2.1 Dry N2 at Anode, Dry and Wet H2 at Cathode
Figure 2 presents a comparison of CV tests conducted on the assembled water electrolysis cell, with N2 flowing through the anode and dry/wet H2 flowing through the cathode, respectively. Here, the membrane electrode remains inactivated, and the environment on both sides of the entire membrane electrode remains dry. As shown in Figure 2, under dry gas conditions, within the potential range of 0.05 ~ 1.4 V, there were no significant redox current peaks. Subsequently, when humidified H2 was introduced, two redox current peaks were observed in the CV curve at around 0.8 V and 1.2 V. Since the membrane electrode used in this experiment was a commercial Ir-Ru electrode, it is considered that the redox current signal peaks in the CV curve at around 0.8 V and 1.15 V correspond to the Ir3+/Ir4+ and Ir4+/Ir5+ changing process, respectively [5]. The two pairs of redox peaks of Ir involve all surface reactions of Ir atoms. As the proton penetrates the lattice, the electrode becomes a capacitor, and the proton becomes one of the carriers. Protons enter from the cathode as the potential increases and leave in the opposite direction as the potential decreases. Therefore, each potential in the CV curve corresponds to a definite charge, thus forming current [6]. It is easy to find that even when the membrane electrode is in a dry state and is unable to transfer electrons within the potential range of 0.05 ~ 1.4 V, the CV curve still exhibits a corresponding current signal, but there is no corresponding redox current peak signal of metal atoms. This is due to the fact that, under normal circumstances, the overall response current in the CV curve is the sum of the electrochemical redox reaction current and the double-layer charging current (ic). The ic generally involves two aspects. On the one hand, when the electrode potential changes, electric double layer charging is required, which thereby alters the charge state at the electrode interface and gives rise to a double-layer charging current. On the other hand, changes in the electric double-layer capacitance can also induce a double-layer charging current. Since the electrode potential always changes at a constant rate during the scanning process, at any given moment there is a non-zero double-layer charging current arising from the state of charge at the interface of electrode potential change. Consequently, ic is always present during the scanning process, and the CV curve displays current variations even when no electrochemical reaction occurs.
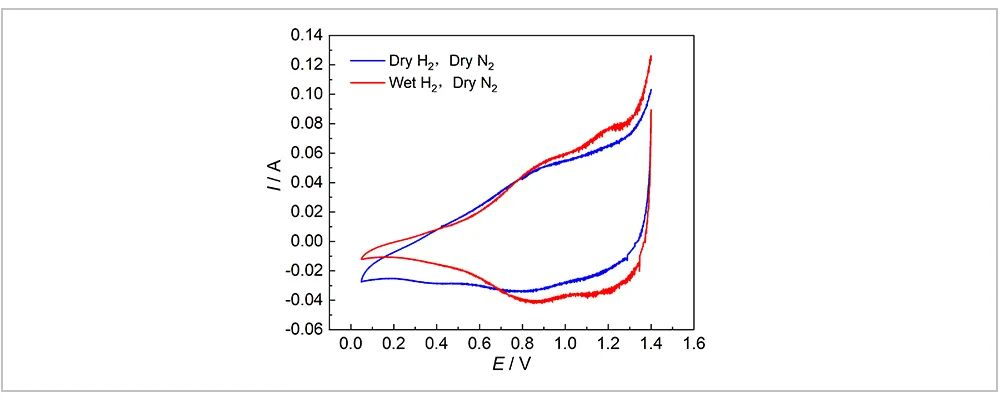
Fig. 2 Comparison of Wet and Dry H2
2.2 Impact of System Water Content
To further explore the impact of water content in the system on the test results, the author conducted a series of experiments, and the results are shown in Figure 3. Under normal circumstances, for the water electrolysis CV test, the inlet gas condition should be humidified nitrogen on the anode side and humidified hydrogen on the cathode side. The related operations of CV test are then performed after the system is purged and the voltage stabilizes below 0.1V. Considering that in the actual operation of water electrolysis, the introduction of humidified gas requires humidification and heating of the test equipment, which is not easily met in most cases, alternative humidification schemes were discussed, including dry nitrogen on the anode side/humidified hydrogen on the cathode side, water on the anode side/humidified hydrogen on the cathode side, and water on the anode side/dry hydrogen on the cathode side. As can be seen from the results in Figure 3, the scheme of water on the anode side and dry hydrogen on the cathode side meets the conventional requirements and does not cause significant deviations in the results. During the CV test of water electrolysis, hydrogen is to reach an equilibrium potential with Pt in the catalyst, similar to a standard electrode; therefore, the supply of hydrogen to the cathode side is necessary. As for water, it is to undergo a redox-like reaction with the active sites of anode-side catalyst, promoting the oxidation of water molecules and the release of electrons. These electrons are then transferred to the anode, where they participate in the formation of redox peaks in the CV curve, indicative of the reactions at the active sites. Without water, the redox reaction at such active sites during the CV process is difficult to complete. As can be seen from Figure 2, when the potential is above 0.8V, the CV curve does not exhibit significant peaks. The results from Figure 3 indicate that as long as there is water in the system and the testing system remains humid in a certain degree, stable testing can be achieved. Whether the water is added through the gas circuit or directly supplied from the anode side does not significantly affect the results, which breaks a new path for future CV testing of water electrolysis.
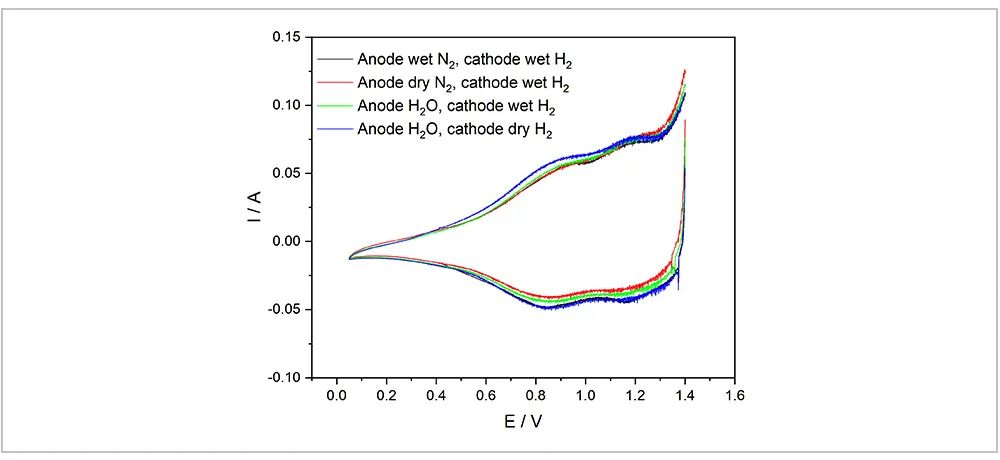
Fig. 3 The Impact of Water on the Test System
To further verify the influence of water content in the system, the author also tested the CV curves before and after the battery was loaded, as shown in Figure 4. Before activation, the test was conducted on a newly installed membrane electrode, with DI water supplied to the anode and dry hydrogen to the cathode. Under such conditions, the CV curve did not show significant redox current signal, which might be because of insufficient exposure of the active sites. However, compared to the pure dry gas test in Figure 2, there was a noticeable peak shape in the high potential region. Furthermore, the author activated the membrane electrode by loading a constant current of 50A for 4 hours, then switching to dry nitrogen for the anode and dry hydrogen for the cathode. The CV curve was tested again under these conditions. This time, the tested CV curve did not show significant differences from the curves in Figure 3, where humidified hydrogen and humidified nitrogen were supplied on the cathode and anode sides, respectively. This might be because of a certain amount of water in the battery, such as water in the titanium felt. Moreover, the cathode and anode of this electrolyzer cell were purged with dry nitrogen for 30 minutes, and then the CV curve was tested again. Compared with the curve after activation, the peak shape changes, but the redox peak shape of the catalyst still appears in the high potential region. This indicates that as long as the system contains a certain amount of water, it will not have a significant impact on the results of CV test.

Fig. 4 The Impact of membrane water content
2.3 Influence of Other Test Conditions
The author also studied CV testing under other operating conditions. Figure 5(a) shows the CV test without using the residual hydrogen from the reaction. The specific operation process is as follows: the single electrolytic cell is operated stably at a constant current of 50A for 1 hour, during which time DI water is continuously supplied to the anode side, while no gas is aerated to the cathode side. It can be seen from the curve that the CV curve loses its basic shape, no basic redox peak, but the double-layer region is relatively smooth. Such test conditions may not be suitable for CV test of water electrolysis. In addition, the author also explored the use of humidified nitrogen on both the cathode and anode sides for CV testing. The curve shape was similar to that obtained from the CV test using the hydrogen gas generated by the reaction, and both conditions were not suitable for CV testing.
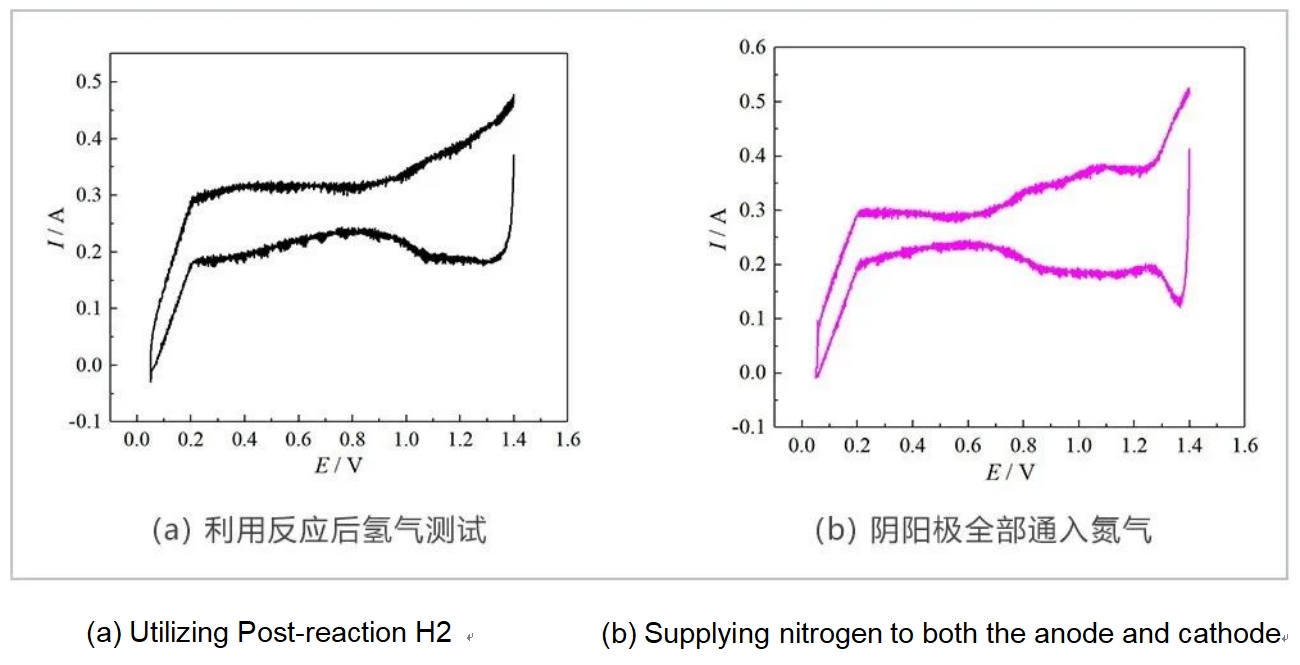
Fig. 5
3. Conclusions
Based on the research results in this paper, the following key points can be concluded: (1) Water is an essential condition in the CV testing process; (2) Water can be introduced by means of gas humidification, but for PEMWE, introducing liquid water to the anode side and dry hydrogen to the cathode side can achieve the same effect as bilateral humidification; (3) It is not advisable to perform CV testing with residual hydrogen from the reaction.
4 Kewell Electrolyzer Cell Test Equipment
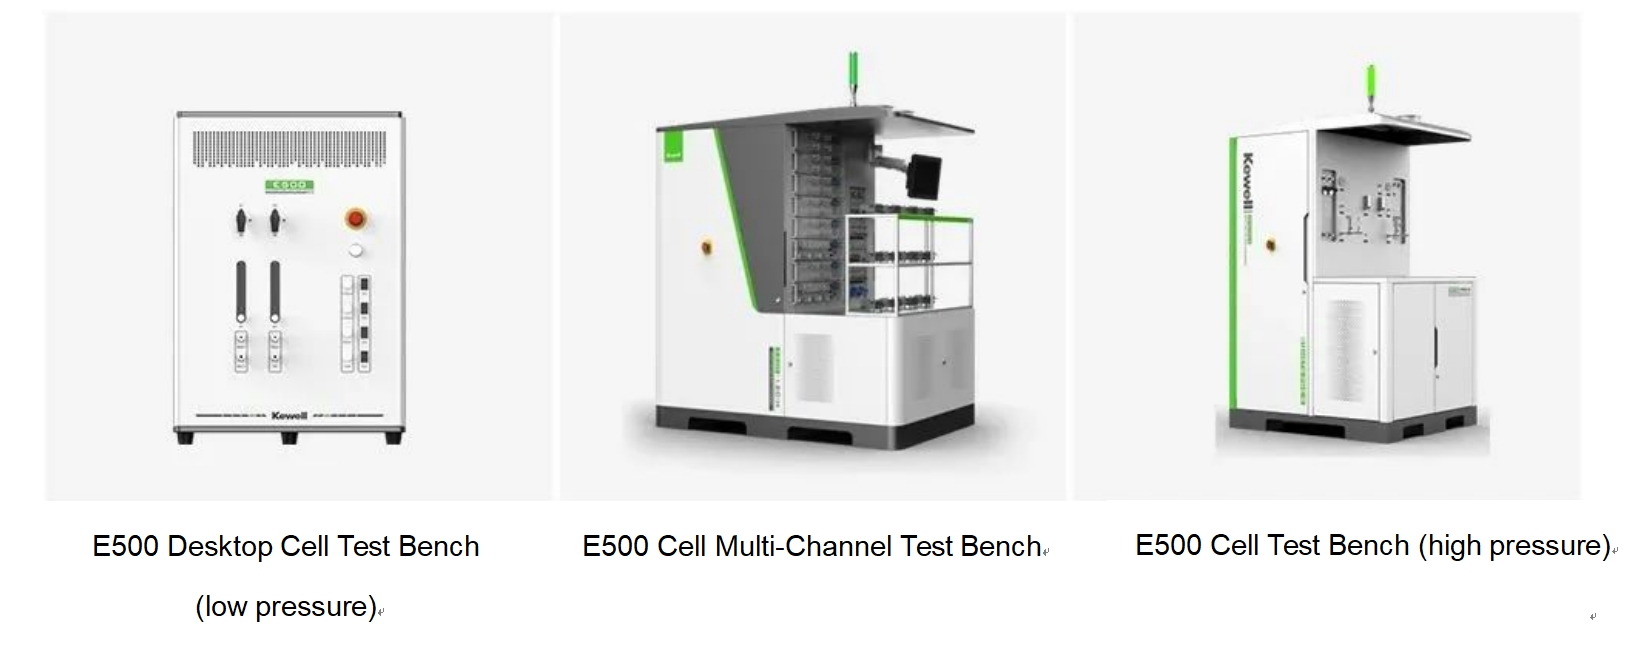
For material level research, development, and verification testing for water electrolysis, Kewell has launched the E500 Series Electrolyzer Cell Test System facing PEM/ALK/AEM electrolyzers, focusing on boundary performance testing, sensitivity testing, electrochemical testing, and durability testing of materials. There is the desktop single-cell test bench (2barg), single-cell multi-channel test bench (modularized, up to 12 channels, available in both low and high-pressure versions), and single-cell high-pressure test benches (up to 5MPag) for users to select.
Product strengths:
① Meet the EU JRC testing standards for electrolyzers.
② Automatic wide-range and high-precision control and monitoring of water flow (with 1% F.S. accuracy), water temperature (±1°C), gas flow (with 1% F.S. accuracy), and system pressure.
③ Gas cooling/drying/filtering, on-line high-precision flow measurement (dew point temperature ≤ -40°C), and on-line rapid sampling and analysis.
④ Equipped with hardware protection for hydrogen leakage and abnormal temperature, manual emergency stop, emergency exhaust, H2 in O2, O2 in H2, and independent safety modules.
⑤ Support sensitivity testing, performance (polarization curve, power curve) testing, and durability testing.
⑥ Support 8-channel simultaneous data storage, multi-axis graphics and icon following, as well as customizable script programming.
⑦ Specialized fixtures: 5cm2, 25cm2, and 50cm2.
⑧ Multiple electrochemical testing approaches: EIS/CV.
References
[1] XU J, AILI D, LI Q, et al. Oxygen evolution catalysts on supports with a 3-D ordered array structure and intrinsic proton conductivity for proton exchange membrane steam electrolysis [J]. Energy & Environmental Science, 2014, 7(2): 820-830.
[2] JIANG G, TENG Y, CHI J, et al. Development of low-cost anode catalyst for PEM water electrolysis [J]. Chinese Journal of Power Sources, 2021, 45(9): 4.
[3] KAN H, WU X, HE L, et al. Influence of operating conditions on CV test of low temperature PEM water electrolysis single cells and mechanism [J]. Energy Storage Science and Technology, 2024.
[4] MALKOW T, PILENGA A, TSOTRIDIS G, et al. EU Harmonised Polarisation Curve Test Method for Low-Temperature Water Electrolysis [J]. 2018.
[5] IRACUSANO S, BAGLIO V, VAN D N, et al. Enhanced performance and durability of low catalyst loading PEM water electrolyser based on a short-side chain perfluorosulfonic ionomer [J]. Applied energy, 2017, 192: 477-489.
[6] GALIZZIOLI, DARIO, TANTARDINI F, et al. Ruthenium dioxide: a new electrode material. I. Behaviour in acid solutions of inert electrolytes [J]. Journal of Applied Electrochemistry, 1974, 4(1): 57-67.


 Position:


