1 Introduction
Green hydrogen is mainly produced by electrolysis of water. The principle of hydrogen generation here can be summarized as follows: connecting the electrolyzer to a DC power supply, when the electrolysis current rises to a certain value, the water in the electrolyzer is electrolyzed into hydrogen and oxygen. Currently, the mainstream hydrogen production technologies based on water electrolysis include alkaline electrolysis (ALK), proton exchange membrane electrolysis (PEM), high-temperature solid oxide electrolysis (SOEC), and anion exchange membrane electrolysis (AEM). The water electrolysis hydrogen production equipment falls within energy-class equipment, and the durability test for a single cell usually lasts for longer than 3000 hours. In such an industrial context, it is necessary that the materials be quickly screened. Therefore, the test program of multi-channel parallel testing for single cells is often adopted for higher test efficiency.
In joint efforts with mainstream water electrolysis research institutes and companies in Europe, Joint Research Centre (JRC) released EU harmonised protocols for testing of low temperature water electrolysers, which is referred to as “JRC protocols” hereinafter. The protocols, being the primary reference in the industry today, specify sensitivity or stress conditions such as temperature, flow, water quality, pressure, and variable load conditions.
In this article with JRC protocols as the main reference, the Kewell E500 multi-channel platform is used for the actual verification of the test methods under different stress load, trying to sort out the mechanism of durability attenuation, especially the attenuation of the membrane electrode under high-pressure conditions. It is expected to facilitate readers’ understanding of the relevant standards.
2 The Necessity of Durability Test under High-pressure Stress Conditions
In actual operation of the water electrolysis system for hydrogen production, increased output pressure reduces the subsequent mechanical compression losses [1]. Currently, high-pressure PEM hydrogen production has already been commercialized. According to the curves of energy consumption of low pressure and high pressure hydrogen production in Figure 1 [2], the total energy consumption increases as hydrogen output pressure rises, but the energy consumption of high pressure electrolysis is significantly reduced relative to low pressure electrolysis combined with mechanical compression. Consequently, higher output pressure and differential pressure operation are the main directions for future developments in electrolyzer technology.
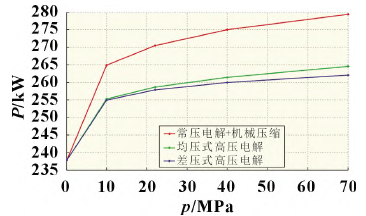
Low pressure electrolysis + mechanical compression
Equal pressure electrolysis under high pressure
Differential pressure electrolysis under high pressure
Fig. 1 Variation of energy consumption with output pressure for the production of 1 mol/s (80.64 Nm3/h) hydrogen under different operating pressure
Therefore, high pressure testing is more in line with the actual use of membrane electrodes, and it can also reflect on the impact of the mechanical stress caused by high pressure on the attenuation of membrane electrodes.
Elevated differential pressure in the electrolyzer also brings about increased hydrogen permeation; and the amount of hydrogen permeation in the actual environment of electrolysis hydrogen production is in proportion to the partial pressure difference of hydrogen [3]. As shown in Figure 2(a), at different temperature, there is a quadratic correlation between hydrogen permeation flux and partial pressure difference. Hydrogen permeation also makes the H2-in-O2 content at the anode too high. As shown in Figure 2(b) [4], the higher the cathode differential pressure, the higher the H2-in-O2 value; at low current densities, hydrogen permeation has the greatest effect on H2-in-O2 content at the anode, which is because low current densities lead to low oxygen yield, therefore lower degree of dilution of hydrogen permeated, therefore higher H2-in-O2 content. After the durability test, the H2-in-O2 content curve changes, and the H2-in-O2 safety range (<2%) narrows, which is very helpful for the safety assessment of the membrane.
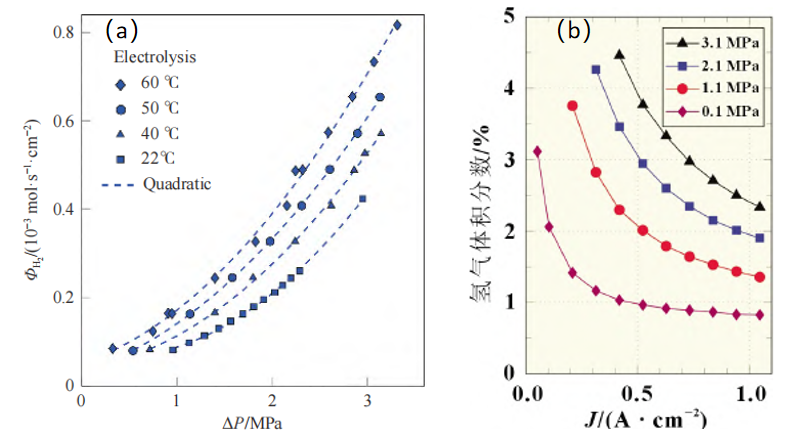
H2 volume fraction
Fig. 2(a) Curve of hydrogen permeation flux vs. partial pressure difference at different temperature (anode pressure: 0.1Mpa)
(b) Effect of cathode pressure on anode H2-in-O2 content
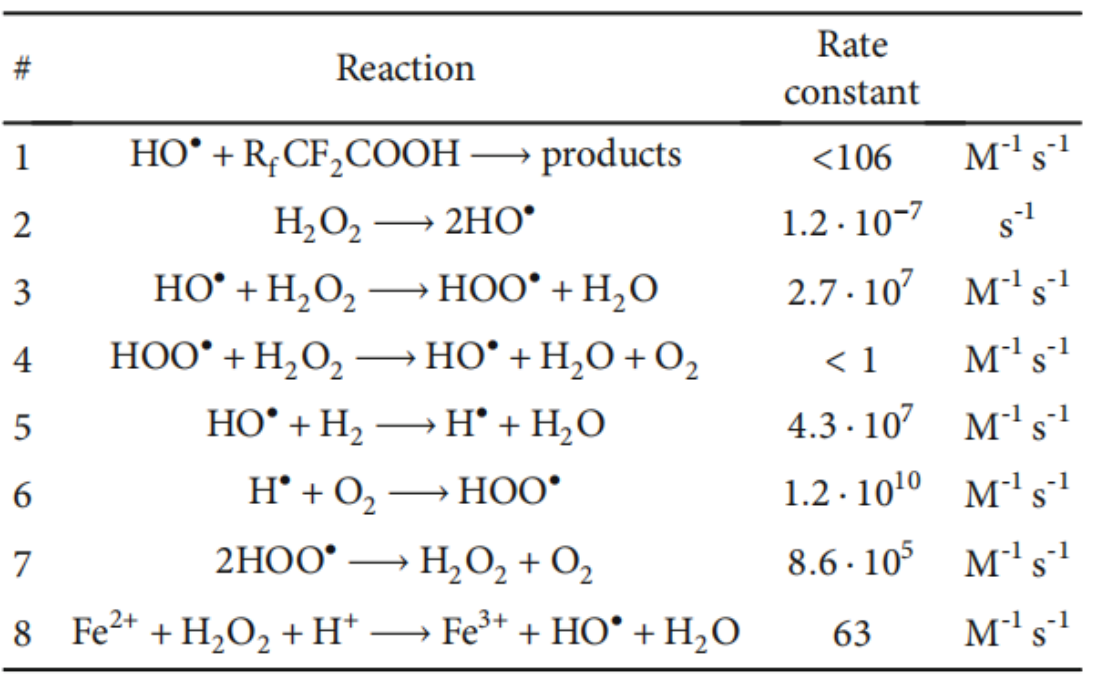
Under high pressure conditions, in addition to increased hydrogen permeation, the possibility of oxygen diffusion across the membrane also increases [5-7], leading to the formation of hydrogen peroxide or free radicals on the catalyst surface [8,9]. As shown in Table 1, free radicals are the most damaging intermediates involved in a wide range of reactions on the membrane surface. Furthermore, they attack on and degrade the perfluorinated main chain and perfluorosulfonic acid side chain and ultimately result in thinner membrane [10] and lower electrolytic performance. The equation of the reaction principle is as follows:

Table 1 Free radical reactions on the surface of membrane catalyst [11]
To sum up, high pressure and high pressure difference not only cause mechanical stress to the membrane, but also irreversibly electrochemically degrade membrane and catalyst due to increased hydrogen-oxygen mixing. JRC protocols also include 3Mpa as a recommended operating condition.
Multi-channel water electrolysis test benches on the market only support low-pressure operation condition; meanwhile, they also have shortcomings such as high channel coupling, limited software function, and low level of automation.
To solve the above problems, Kewell has launched the E500 multi-channel test system for PEM electrolysis, aiming to provide a precise, reliable, and efficient high-pressure test platform for PEM electrolyzers. E500 supports polarization curve testing, electrochemical testing, sensitivity testing, durability testing, testing of the energy consumption and efficiency of hydrogen production, hydrogen production quality, and product service life of PEM electrolyzers. The equipment adopts a modularized layout that allows for adjustment of the number of modules and free combination of high/low pressure or different functional modules. It is one platform for a variety of application scenarios, reducing customer’s investment in equipment and facilitating possible adjustments in the future.
2 Experimental Setup
To study whether multi-channel system can provide a stable test environment for multiple water electrolysis cells, an experiment is set up based on the E500 multi-channel water electrolysis single cell test system of Kewell Technology Co., Ltd., as shown in Figure 3. The cell fixture is Kewell’s self-developed single cell fixture with an active area of 25 cm2, as shown in Figure 4.
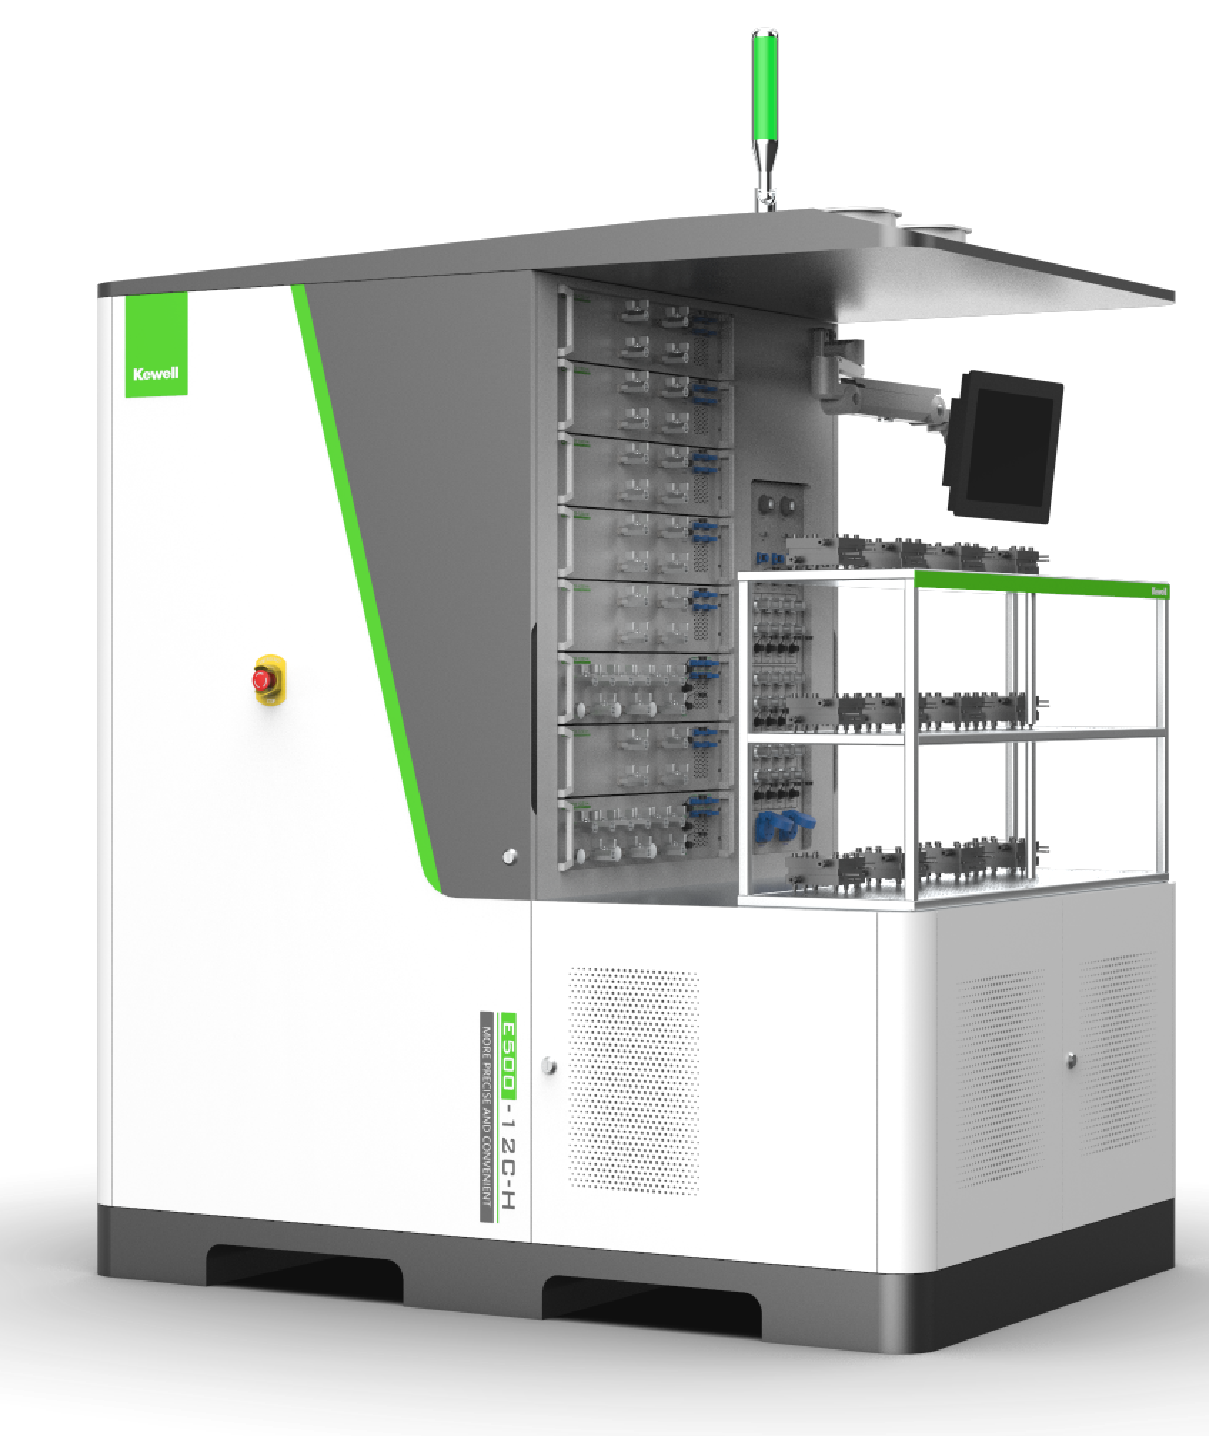
Fig. 3 E500 multi-channel water electrolysis single cell test system
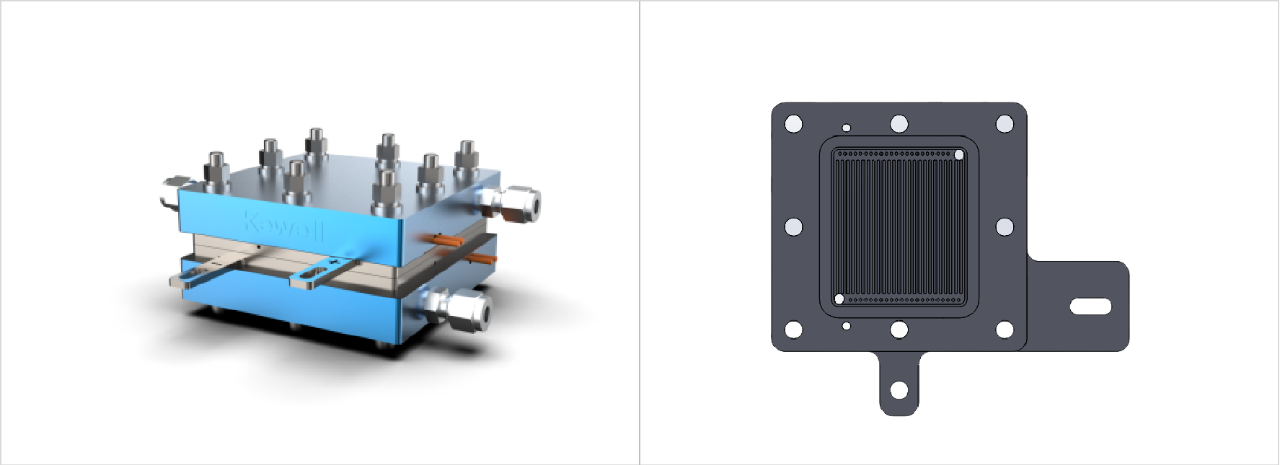
Fig. 4 The 25cm2 water electrolysis cell fixture
3 Results and Discussion
3.1 Sensitivity Test
3.1.1 Methods
According to the JRC test standard [12] in EU LTWE, and to study the effect of operation stressor on the performance of PEMWE single cells, Kewell refers to the JRC test methods (as shown in Figure 5) and performs tests with respect to the dynamics of temperature, pressure and flow. Here, the membrane electrode selected is NR-117-1.69mgIrcm-2.
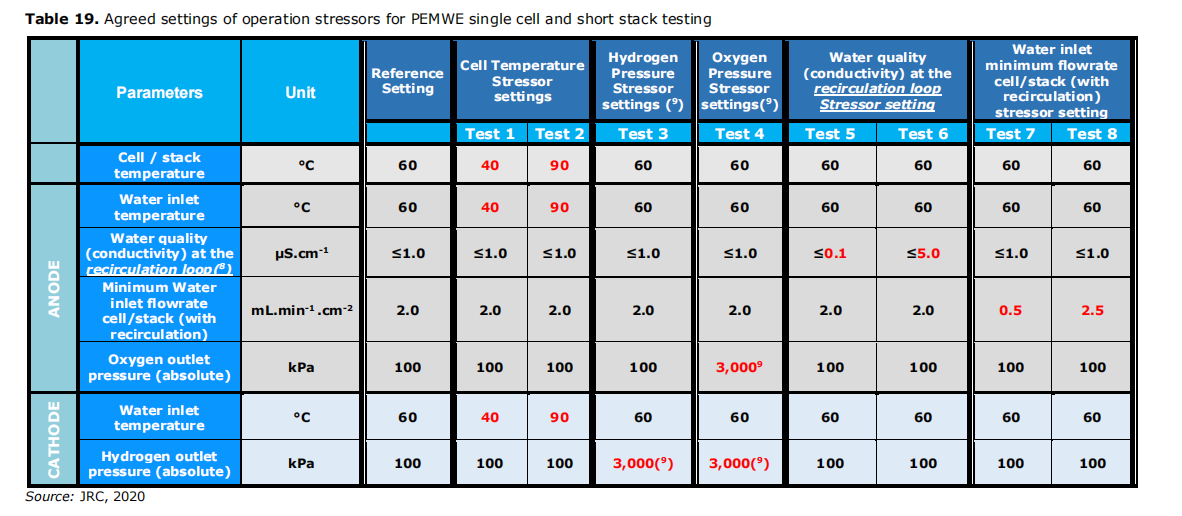
Fig. 5 JRC test methods for the effect of stressor on single cell performance
3.1.2 The Effect of Temperature on Electrolyzer
Studies have shown that appropriately increasing the temperature of the electrolyte entering the electrolyzer enhances efficiency, speeds up the transport of hydrogen ions, increases the rate of reaction, and thereby increases hydrogen yield. However, excessively high temperature of the inlet electrolyte can lead to failure of the membrane material inside the electrolyzer (when the temperature increases from 80°C to 90℃, the degradation rate will increase from 3.0 μV?1 to 183.8 μV?1), and susceptibility to water loss and degradation, thus affecting the stability and service life of the electrolyzer. Therefore, we need to ensure the high efficiency of hydrogen production and at the same time control the temperature of the inlet electrolyte within an appropriate range.
The temperature sensitivity test refers to JRC test methods, with specific data shown in Figure 6. Operating conditions: circulating water flow = 50 ml/min; normal pressure; temperature = 40, 60, 90℃. According to the polarization curves below, the higher the temperature, the lower the voltage at the same electrical density; e.g., electrolyzer 1: 2.155V@2.0A/cm2 at 40℃, 2.0575V@2.0A/cm2 at 60℃, 1.98V@2.0A/cm2 at 90℃. The reason is that higher water temperature reduces mass transfer resistance, increases exchange current density and conductivity, and improves the corresponding performance of the electrolyzer and the hydrogen yield.

Fig. 6 Polarization curves of 4-channel system under normal pressure and circulating water flow of 50 ml/min, temperature = 40, 60, 90℃
3.1.3 The Effect of Pressure on Electrolyzer
According to relevant studies, when such conditions as operating temperature and electrolyte are the same, as the operating pressure of the electrolyzer increases, the humidity content of the gas drops, which suggests that improving the operating pressure is a way to reduce gas humidity. In addition, Kewell’s E500 multi-channel test system with high pressure and gas-water separation and drying modules is able to directly meet customers’ pressure demand.
The pressure sensitivity test refers to JRC test methods, with specific data shown in Figure 7. Operating conditions: circulating water flow = 50 ml/min, temperature = 60℃, pressure = 100, 1000, 3000kPa. According to the figures below, the curves of each electrolyzer roughly coincide under different pressure, especially in the stage of low current density (<1A/cm2).
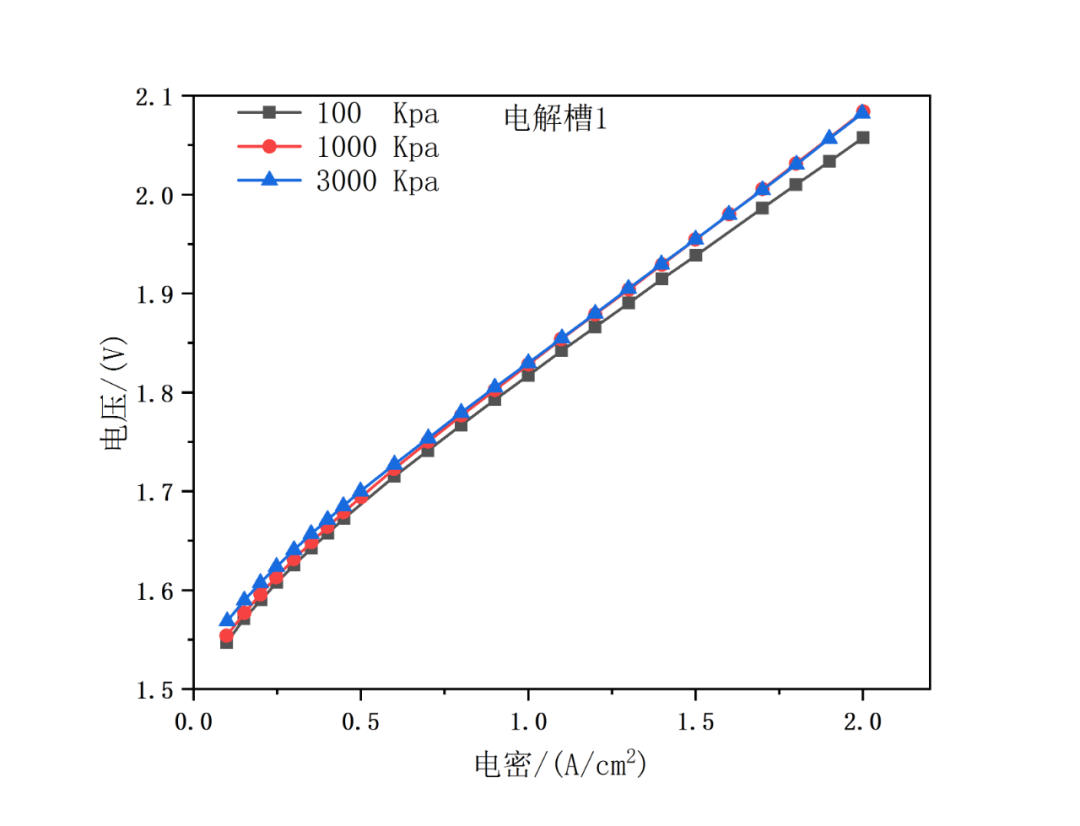
Fig. 7 Polarization curves of 4-channel system at circulating water flow of 50 ml/min and temperature of 60℃, under pressure of 100, 1000 and 3000kPa
3.1.4 The Effect of Flow on Electrolyzer
The rate of consumption of DI water during the operation of the PEM electrolyzer mainly includes consumption of water decomposition, cathode permeate water and water evaporation. It has a high demand on the quality of the reactant water, with a focus on the effect of metal ions on the membrane. Kewell’s E500 multi-channel electrolyzer test system has deionizer and water flow regulation functions, meeting the requirement of PEM electrolyzers for the quality of reaction water. Meanwhile, research institutes exploring the attenuation of various components in PEM electrolyzers have also found that changes in water flow could increase ohmic impedance. To avoid gas permeation on either side induced by damage of the membrane electrodes, we need to pay extra attention to water flow control during the operation of the electrolyzer.
The flow sensitivity test refers to JRC test methods, with specific data shown in Figure 8. Operating conditions: temperature = 60℃, normal pressure, circulating water flow = 50, 200, 500 ml/min. According to the figures below, the curves of each electrolyzer roughly coincide at different flow rate, especially in the stage of low current density (<0.5A/cm2).
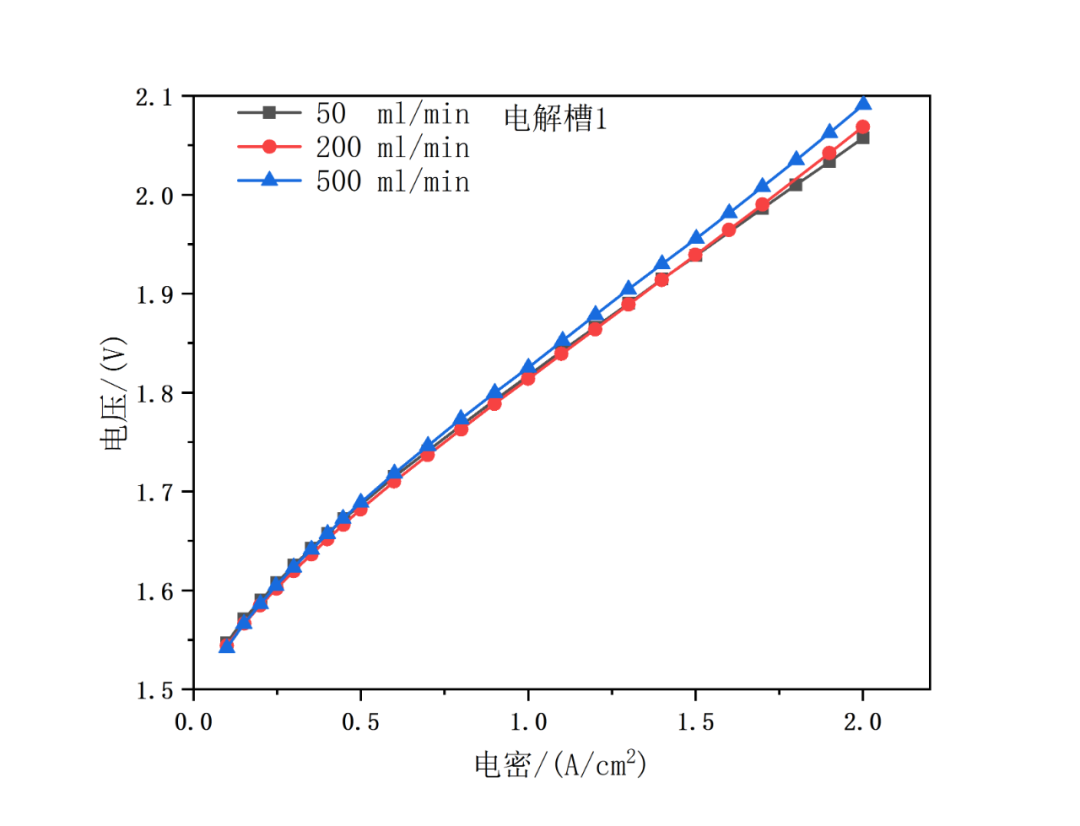
Fig. 8 Polarization curves of 4-channel system at temperature of 60℃ and normal pressure, circulating water flow = 50, 200, 500 ml/min
3.2 Conductivity Control
During electrolyzer operation, impurities can significantly affect MEA performance. When the ultrapure water equipment fails, the performance of the electrolyzer will be severely degraded. Kewell has calibrated the conductivity sensor and determined a reasonable temperature compensation coefficient through coupling (referring to the 0.055us/cm standard of industrial ultrapure water). The effect is as shown in Figure 9.
With the temperature compensation coefficient for the conductivity sensor, the conductivity remains more consistent. When there is no change in water quality, the conductivity sensor can achieve linear compensation from low temperature to high temperature. The long-term conductivity test data is shown in Figure 10.
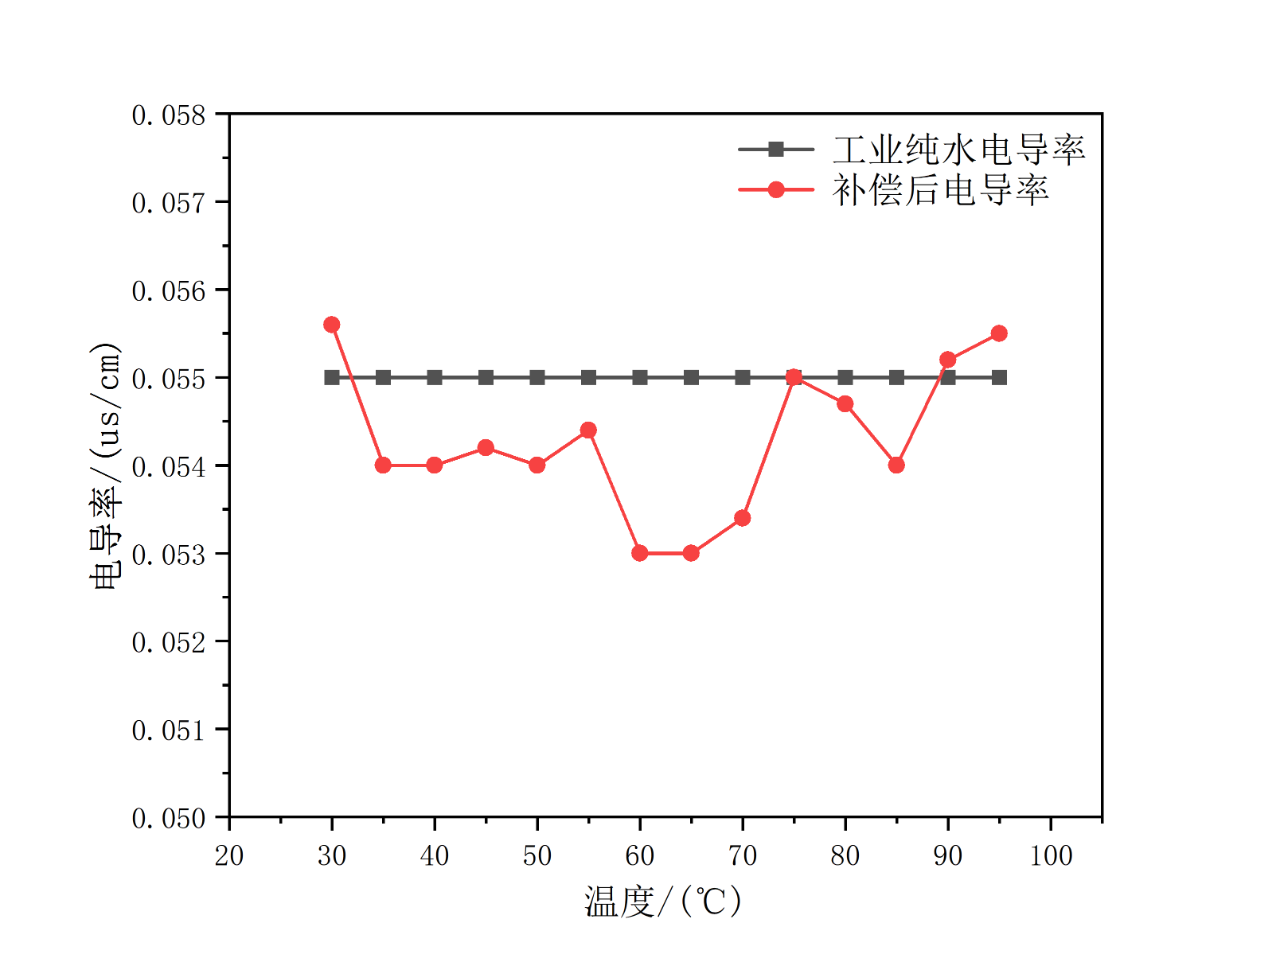
Fig. 9 Compensated conductivity at different temperature
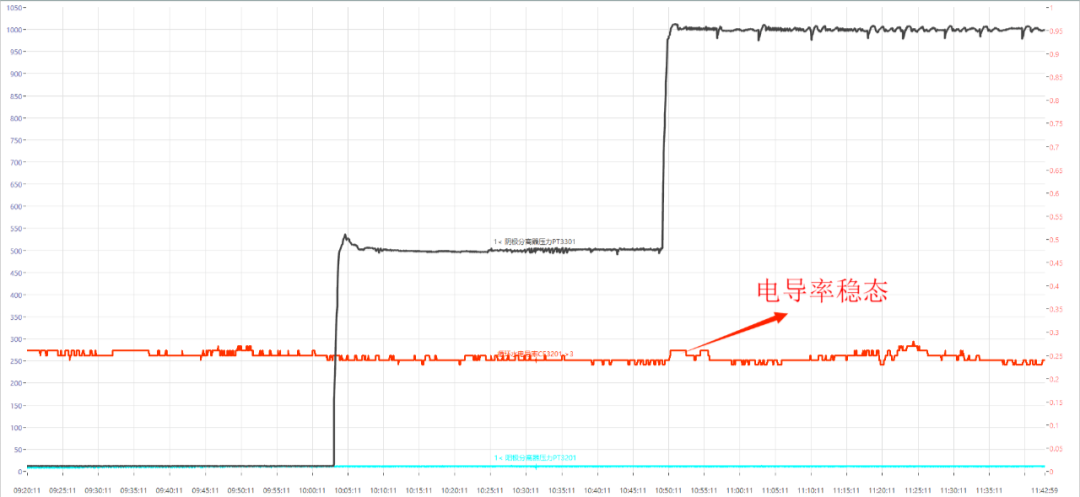
电导率稳态:Conductivity steady-state
Fig. 10 Long-term conductivity curve of system operation, equipped with resin tank (<0.3us/cm)
3.3 H2-in-O2 Concentration Test
The test bench detects the H2-in-O2 content in each channel by monitoring and switching, which approach features better dynamic performance and greater independence of the modules. Monitoring has no impact on system stability. During monitoring and switching, flow fluctuation is 5ml/min and temperature fluctuation is 0.5℃. According to the test results, the H2-in-O2 content monitoring in the multi-channel electrolyzer system is of rapid response and high repeatability.
3.3.1 Response Time and Repeatability
As shown in Figure 11, under normal pressure, the response time of electrolyzer A and electrolyzer B (current: 50A and 12.5A, respectively) is 6min@0.5A/cm2 and 4min@2A/cm2;
As shown in Figure 12, under the high pressure of 3Mpa, the response time of electrolyzer A and electrolyzer B (current: 12.5A and 50A, respectively) is 50min@0.5A/cm2 and 30min@2A/cm2.

Fig. 11 Curves of response time of H2-in-O2 in channel under normal pressure
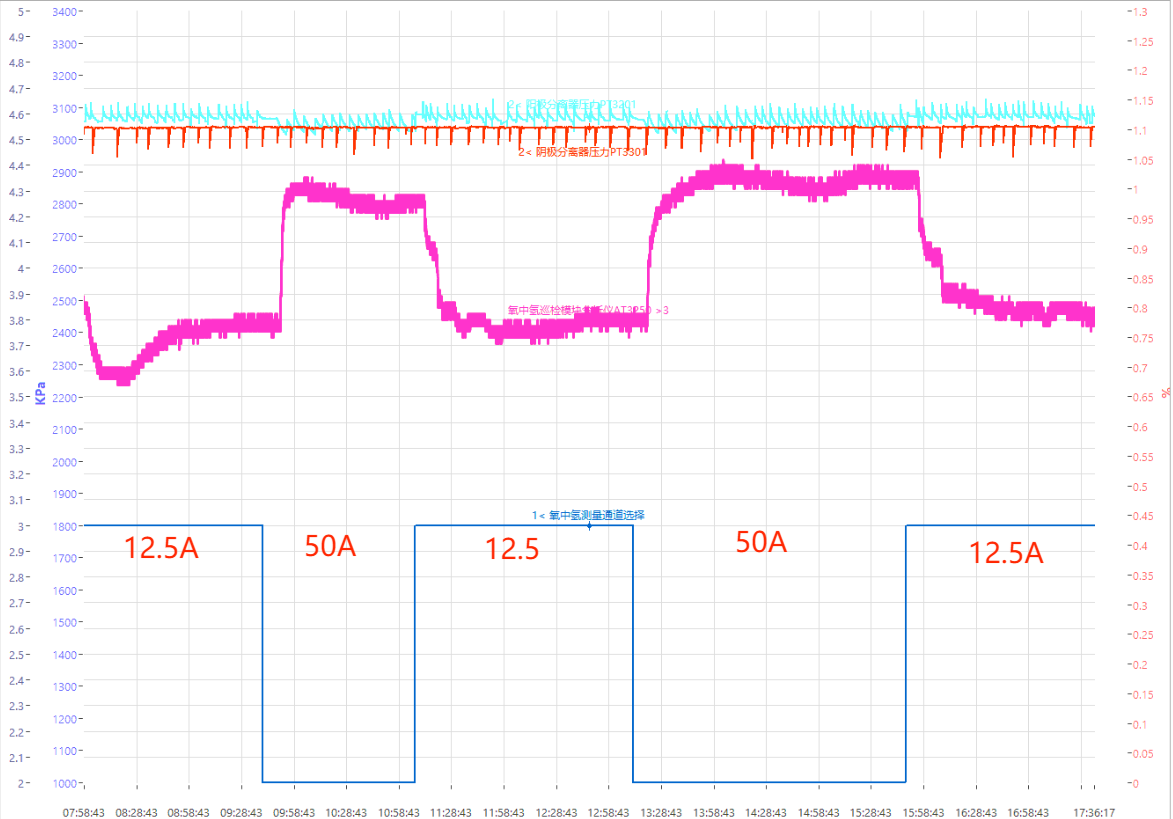
Fig. 12 Curves of response time of H2-in-O2 in channel under the pressure of 3Mpa
3.3.2 Current Density Change
When testing the change of current density (2A/cm2 and 0.5A/cm2) of a single electrolyzer under normal pressure, the H2-in-O2 display rises from 2.1% to 2.5%, which agrees with Figure 2(b), where H2-in-O2 is inversely proportional to current density. Here, the high H2-in-O2 display is due to the deterioration of the membrane performance over a long period of durability test.
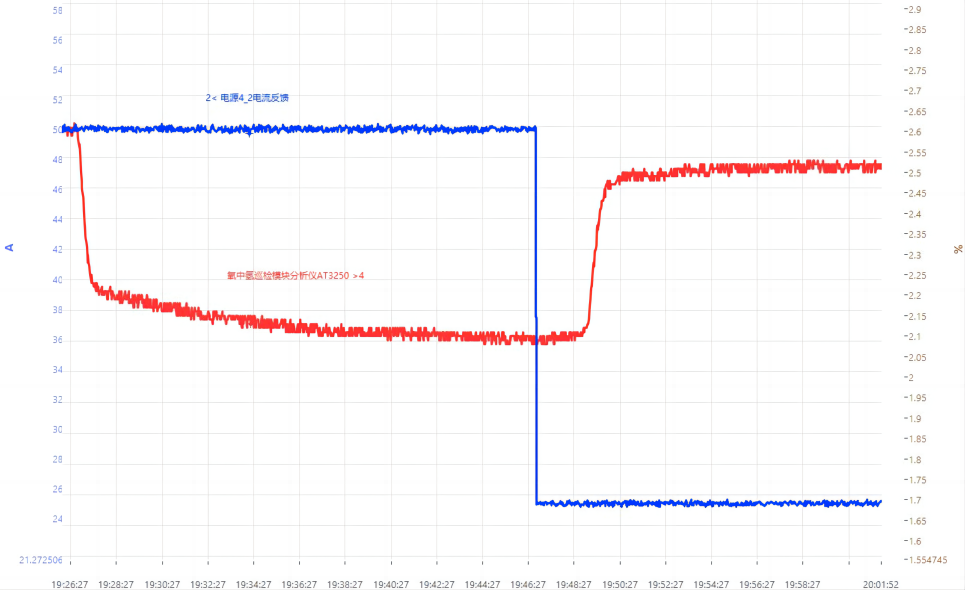
Fig. 13 Curve of H2-in-O2 response time upon current density change
3.4 JRC Durability Test
Electrolyzer performance changes during the durability test. As shown in Figure 14, according to the variable load (3A/cm2-0.1A/cm2) test at high and low current density, there is an initial increase in activity (≈50mV after 10 cycles), followed by a significant drop in electrolytic performance during extended cycles due to the increase of high frequency resistance (HFR) (≈1.6 times after 718 cycles) [13]. The initial performance enhancement is because hydrogen accumulation causes the surface of hot IrO2 anode catalyst to reduce to metallic Ir, and the subsequent action of the oxidation catalyst transforms crystalline IrO2 into more active amorphous IrO2. The long-term performance degradation is caused by the increase of HFR, and an increase in contact resistance due to Ti-PTL passivation during variable load cycling. For the poor electrical conductivity of the passivated PTL surface and reduced conductivity of the catalyst, the interfacial contact resistance between the catalyst layer and PTL raises, thus increasing HFR.
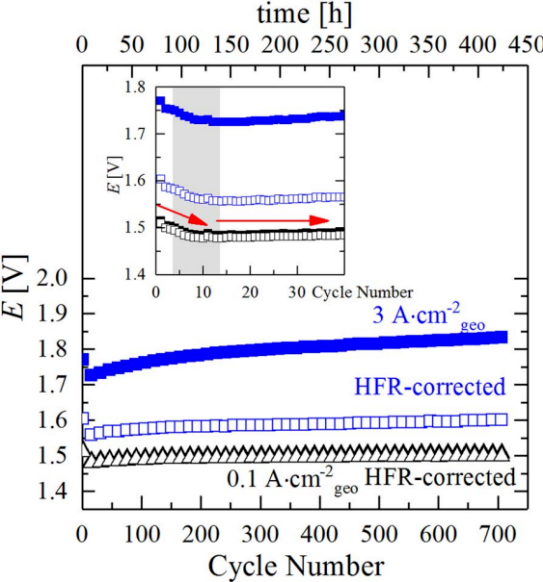
Fig. 14 Curve of battery voltage change with the number of cycles of variable load durability test
Figure 15 introduces the JRC durability test methods adopted this time. Given an initial value (e.g., constant current 50A), and shed load 0%-25%-50%-75%-100%-75%-50%-25%-0% on the basis of the initial value, at an interval of 60S, and observe the curve (Figure 16).

Fig. 15 JRC durability test methods
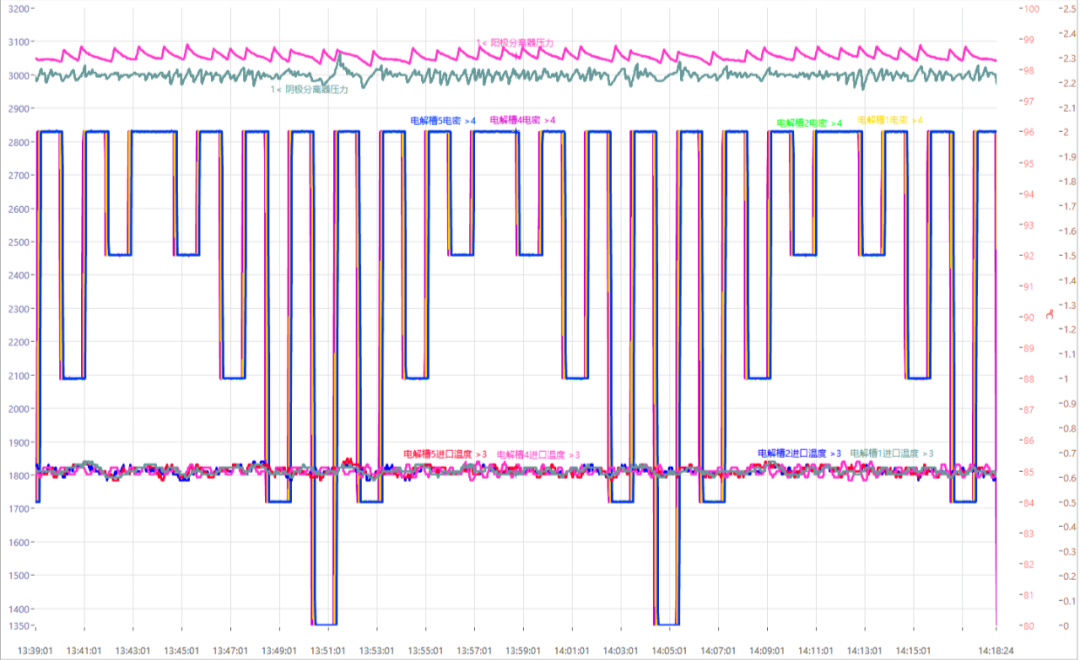
Fig. 16 Curve of 4-channel current loading according to JRC standards
Conclusion of durability test: For both loading and unloading, the current can reach the set value in about 6s. And it can operate for a long time according to the preset parameters and cycle times.
According to the JRC durability test data, Kewell’s E500 multi-channel electrolyzer test system meets the requirements of a variety of accelerated durability tests such as circulating water variable load [14], temperature variation [9], OCV-AST [13], current/voltage load cycling [15-17], and CCM-ADT (accelerated degradation test) [18]. For example, the CCM-ADT combined with polarization curve is shown in Figure 17 below, as the number of test cycles increases, the electrolyzer performance degrades and the current is lower at the same voltage.
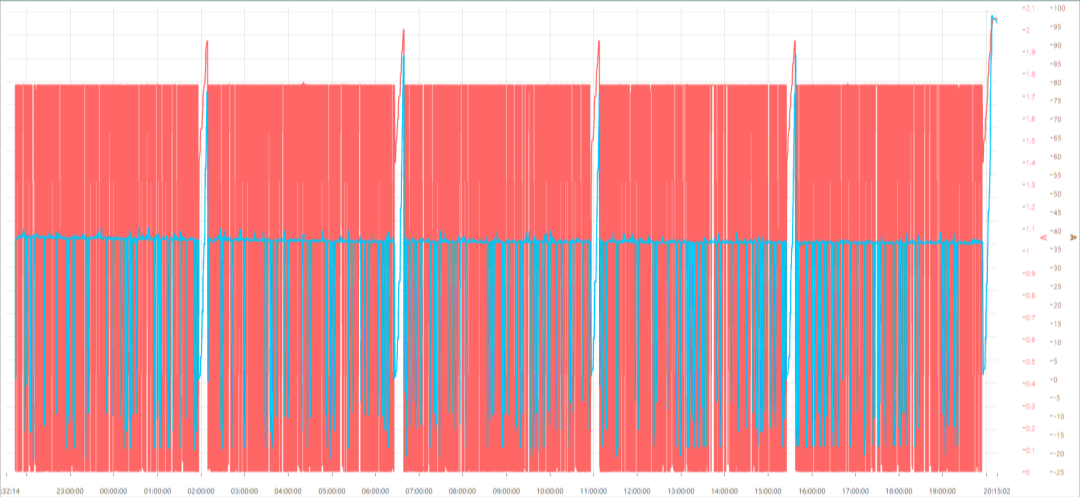
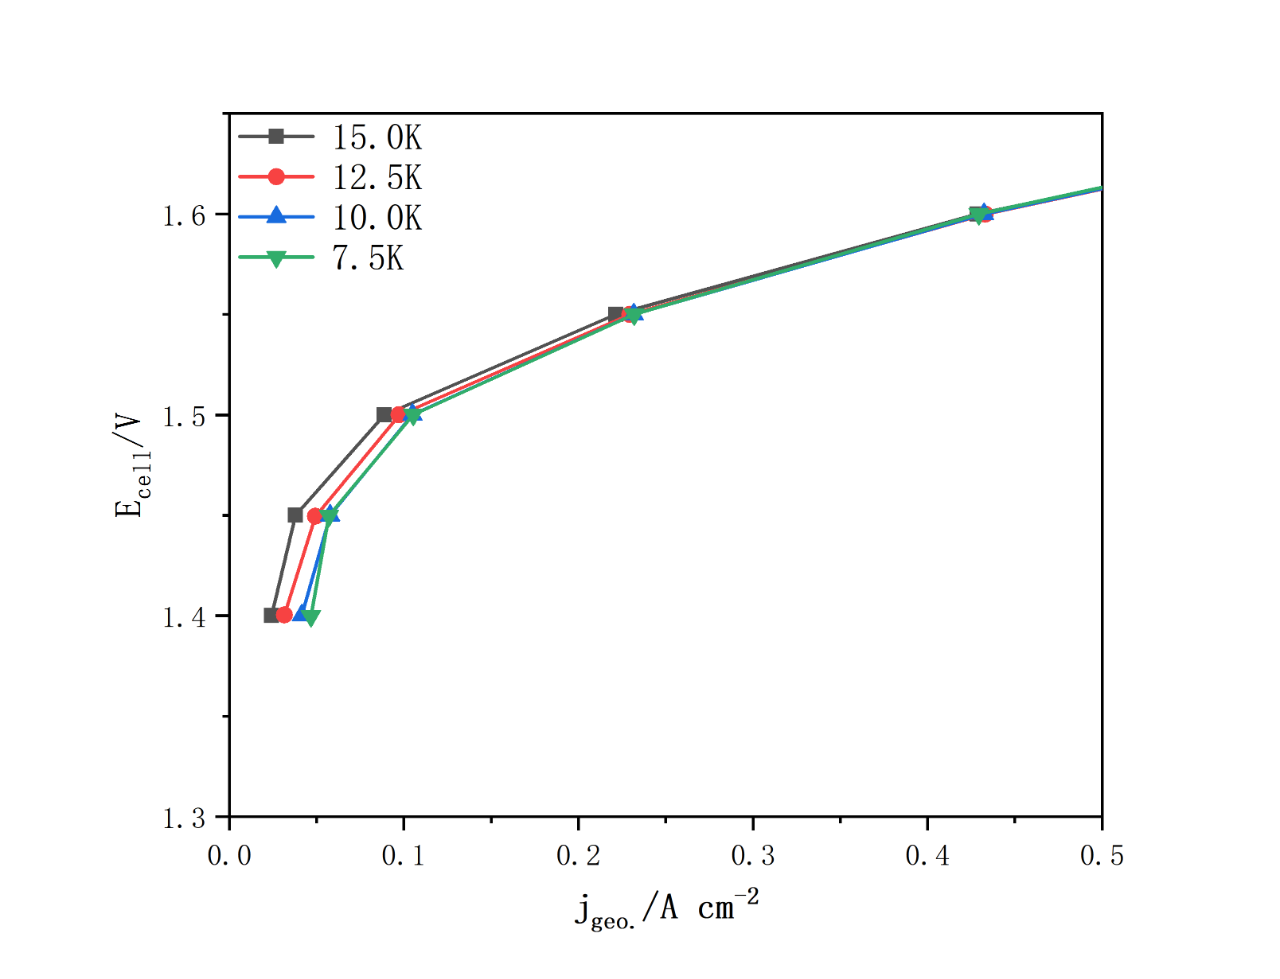
Fig. 17 Testing at temperature of 80℃ and water flow of 50ml/min
(a) Current and voltage curves in durability testing; (b) polarization curves
3.5 The Effect of System Water Make-up on Electrolyzer Operating Status
As shown in Figure 18, system pressure is 3Mpa, run under load, low level of anode separator, make-up pump ON, the level of anode separator fluctuates, leading to anode pressure fluctuation. Make-up water level set to 2mm, anode pressure fluctuation = 30kPa (0.8%FS), no impact on temperature, only little flow fluctuation. In addition, cathode drainage caused no significant fluctuations in cathode pressure.
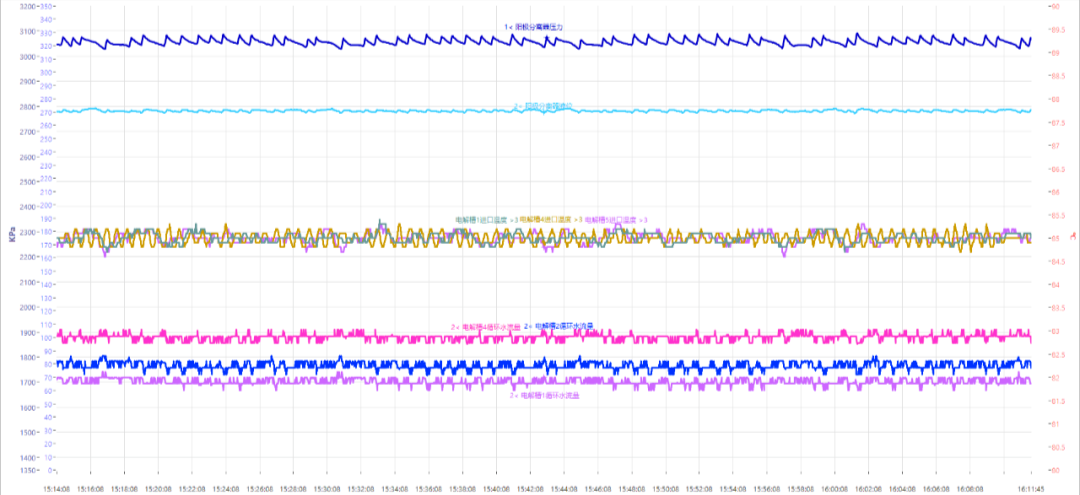
Fig. 18 Curves of electrolyzer performance fluctuations upon system water make-up
4 Conclusion
Based on the above tests, the following important information can be derived:
1) According to the polarization curves, temperature has the most significant effect on electrolyzer performance, as mass transfer resistance decreases and current density increases, the corresponding performance and hydrogen production of the electrolyzer are enhanced. Pressure and flow only have limited effect, but pressure has a large effect on the stability of H2-in-O2 concentration.
2) The H2-in-O2 testing approach of monitoring and switching has no effect on the temperature, flow and pressure control of each channel.
3) H2-in-O2 detection achieves rapid response at the low current density of 0.5A/cm2. The stability time at normal pressure is 6min; at the high pressure of 3Mpa, it is 50min.
4) Long-term durability test under high pressure impairs electrolyzer performance. One reason for that is oxygen and hydrogen that pass through the membrane producing free radicals on the catalyst surface.
5 Product Strengths
1) In line with relevant electrolyzer test requirements raised by EU JRC.
2) Support conductivity temperature compensation at high temperature, and online accurate measurement of conductivity at high temperature and high pressure, with error ≤0.01us/cm.
3) The temperature, pressure and flow of each channel can be controlled separately, water flow 1%F.S., temperature±1℃, gas flow ±(0.8%Rdg+0.2%F.S.) and automatic wide-range high-precision pressure control (0.8%F.S.).
4) Modularized, integrated test bench, main control unit + standard modules/ professional modules, with high pressure (0-4Mpa) and low pressure (0-0.5Mpa) versions for users to select. Up to 12 channels and 8 modules, meeting multi-channel test scenarios with higher efficiency.
5) Dimensions of multi-channel test bench: 1.2m (width) × 1.8m (length) × 2.0m (height), small footprint.
6) Gas cooling/drying/filter, online accurate flow measurement, and online rapid sampling and analysis of H2-in-O2.
7) Protections for hydrogen leak and abnormal temperature, manual emergency stop, emergency venting, H2-in-O2 monitoring, and independent safety module for hardware protection.
8) Support sensitivity (pressure, flow, temperature, etc.), performance (polarization curve, power curve) and durability testing.
9) Multi-channel simultaneous data saving, multi-axis graphics and icon dragging, custom scripting; fixtures of multiple specifications dedicated to PEM water electrolysis, 5cm2, 25cm2, 50cm2, etc.
10) Equipped with various electrochemical test methods, such as EIS/CV (an electrochemical workstation is required).
References
…


 Position:


